Where the Heck Is the Ice? Deriving Arctic Sea Ice Concentrations Using Remote Sensing Methods

Atmospheric Science Students

By Ryenne “Rye” Julian

Did you know that sea ice, especially in the Arctic, is forecasted just like the weather? It turns out that sea ice is both a significant tool and obstacle for people residing in areas of the Arctic circle, subsistence hunters, ships looking to navigate through the Arctic passages, and people studying the climatology of the Arctic tundra. So, yes – it’s a little bit important to understand how ice is changing, moving, and behaving daily. Although a lot of work is done to collect data about ice through physical measurements and buoy tracking, satellites play a major role in monitoring the conditions of ice. The only drawback with satellites is that many of them are unable to take readings at night and though clouds (for example, the NOAA – 20 Visual Infrared Imaging Radiometer Suite (VIIRS)), which proves an issue on many days, especially during the Arctic winter when the North Pole is cast in 24-hour darkness.
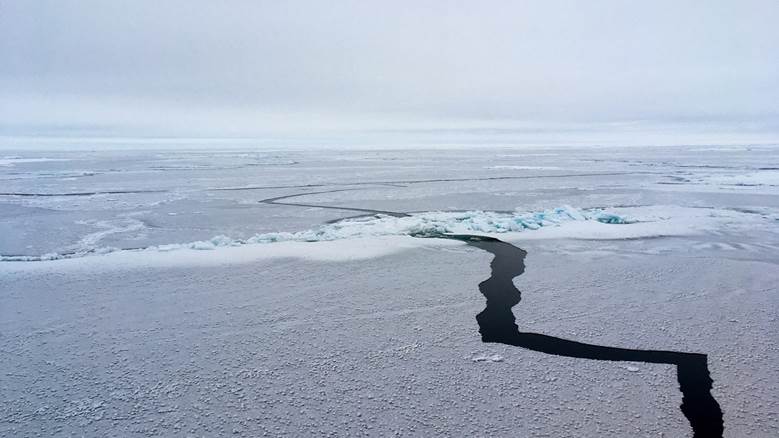
Arctic Ice with carved out ship path taken by Daniel Watkins, Brown University.

How can we go about navigating this issue? Although most of the Arctic circle freezes up during winter, thus limiting shipping operations, being able to make ice forecasts is still vital to residents of the area, local tribal nations, climate records, and subsistence hunters. The specific variable of interest for this project is sea ice concentration, which is defined as the understanding of the percentile of ice present. For example, an 80% ice concentration means that there is an 80% chance that ice is present in that area – it has nothing to do with ice depth, thickness, or extent. Understanding sea ice concentrations is especially important during the spring and summer seasons, when monitoring areas where the ice edge meets ocean water becomes both difficult and an active threat to human safety. But… if satellites can’t tell us this information all year long, and buoys may not be a feasible option for continuous monitoring, what can we do?

This summer, I had the privilege of studying with ice scientists at the National Atmospheric Ocean Administration (NOAA) as a recipient of the Ernest F. Hollings student scholarship and internship program. I have family members who have worked in Alaska, Greenland, and Antarctica, which sparked my interest in studying polar meteorology and climatology. So, when I got to choose what research to do, it made the most sense for me to work on something that dealt with monitoring ice changes. I quickly became indoctrinated into the world of ice forecasting as a novice researcher with one primary goal: find a way to consistently monitor sea ice concentration for ice forecasting.

Our primary satellite products that we have been using as tools for our research are the Synthetic Aperture Radar (SAR), the NOAA – 20 Visual Infrared Imaging Radiometer Suite (VIIRS) sea ice concentration product, and an AI product by the title of IceLynx. IceLynx is trained purely off the data received by SAR, and SAR is essentially just a radar in space that shoots down lasers and creates an image based on the roughness of the surface the laser just hit. The upside to SAR is that it is not inhabited by lack of light or clouds, making it the perfect instrument for continuous sea ice concentration.

You may be thinking, Wow! If SAR can do all of that, why do we even need to do this research? Unfortunately, SAR sometimes gets things wrong. Sometimes, it can mistake rough winds on the surface of the ocean like ice. Or it can make mistakes with puddles that form on the top of ice as they melt as areas of open water. This problematic phenomenon is known as “tone reversal,” which makes SAR backscatter values rather difficult to interpret. For example, what if ice forecasters were to tell a shipping vessel there was a big patch of open water, when there is a thick sheet of ice with a few inches of melting water on top? Dangerous consequences may ensue. Since the IceLynx AI product is trained only off SAR, it is prone to inaccurate readings as well, wasting the time and energy of the ice forecasters.

A real Normalized Radar Cross Section (NCRS) of SAR data from October 29th, 2025. This is an active example of the data we are working with. Each greyish to black pixel that is present in areas of the Arctic Ocean is a different backscatter value displayed by the surface roughness read in by SAR. NOAA CoastWatch L1/L2 Spatial Search.

So, the primary goal of our research is the following: if we can derive a relationship between the SAR backscatter values and true sea ice concentrations from the VIIRS data, then we may be better able to navigate the issue of tone reversal and help retrain various AI products as well as inform ice forecasters what to look out for when tone reversal is occurring. If we can complete our goal utilizing ArcGIS Pro to parse through our satellite data and start examining statistical relationships that occur between certain backscatter values and sea ice concentrations, then we may be able to help the ice forecasters around the globe stop asking themselves: “Where the heck is the ice?”


Ryenne “Rye” C. Julian is a senior Atmospheric and Environmental Sciences (AES) undergraduate student set to graduate in December of 2026. They have had a variety of internship opportunities working with topics such as small-scale climate research, helping to write a climate action plan, studying micrometeorology and agrivoltaics, and most recently, studying how applied remote sensing methods can be used to study sea ice and better train ice forecasting AI programs with the National Oceanic and Atmospheric Administration (NOAA). Her passion for the study of ice came from the start of her undergraduate degree being spent at Northland College as a climatology student before transferring to South Dakota Mines in 2024 because of Northland College’s closure. At SD Mines they have been able to apply both meteorological and climatological methods to their studies.

Hail no! Making Hailstones Smaller One Cloud Seed at a Time

Atmospheric Science Students

By Ashley Walker

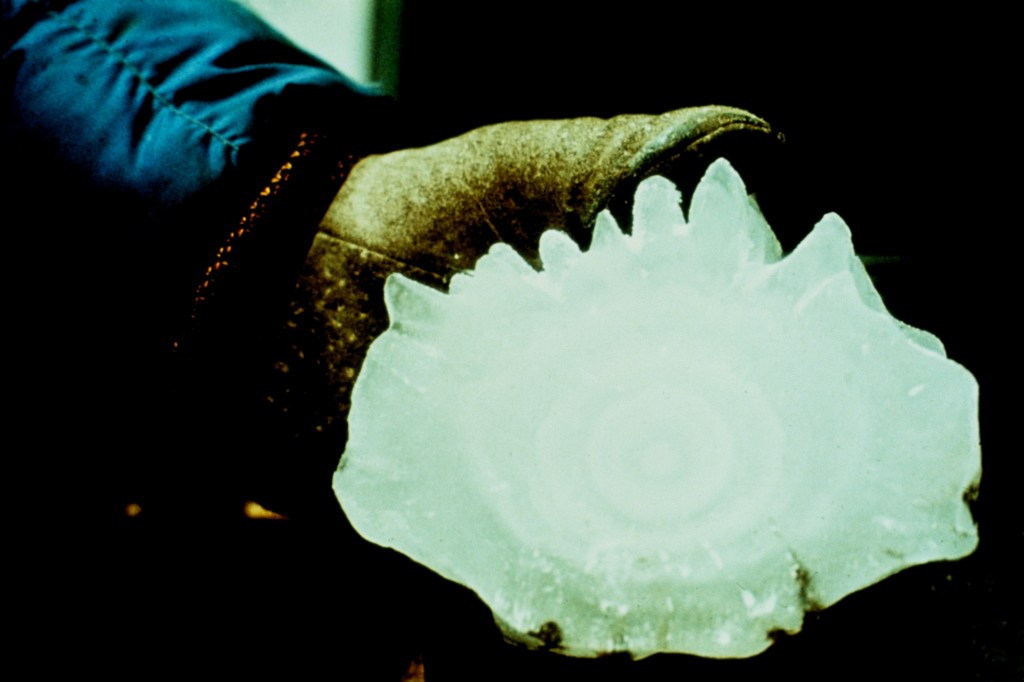
Every year the United States suffers from millions of dollars of hail damage to crops, homes, businesses, etc. In 2023, hail resulted in $2.3 billion in damage in the United States alone (NOAA, 2024). Figuring out if we can minimize hail size could make a huge difference. My research focuses on the physics involved in cloud seeding and how this might influence hail formation.

Cloud seeding is a weather modification tool where substances like silver iodide are added to the atmosphere to produce precipitation if moisture is present in that atmosphere. The substances act as cloud condensation nuclei, which helps the formation of ice crystals. If the number of ice crystals were to increase, they would be competing to absorb water. As the water attaches to these particles, it freezes and combines with other droplets to form hail. This increased competition can result in smaller hailstones, which could cause less damage and help communities that are impacted by severe hailstorms. While a lot of research has been done on cloud seedings overall effects, like increasing rainfall, its ability to reduce hail size is not consistent in research. Studies have shown mixed results, some suggesting that cloud seeding does limit hail size, while other studies suggest that cloud seeding has no impact on hail size. These findings emphasize the need to further research to see if cloud seeding is a good tool to reduce hail size.

A very large hailstone cut in half revealing its “rings of growth.” This likely caused severe damage to the surrounding environment. Photo credit: NOAA Legacy Photo; OAR/ERL/Wave Propagation Laboratory (via Flickr).

To explore this, I am using the CM1 Model (Cloud Model 1) to simulate thunderstorms and study how cloud seeding might influence hail formation. CM1 is a numerical model that allows us to simulate weather like thunderstorms, squall lines, and other systems. The model allows the user to adjust different variables like temperature, moisture, and microphysics. This is an ideal tool to study the processes behind hail formation.

In Hot Water: The Global Change in Hurricane Intensity

Atmospheric Science Students

By Joshua Rowe

Since I was a kid, I have always had an interest in coastal weather. I saw the Pacific Ocean for the first time when I was four years old, and I was in awe of the immense size and natural harmony of the ocean. What sparked my interest in research in this field was the recent global change in tropical cyclone intensity. The warming of the oceans globally has led to an increase in the proportion of intense hurricanes (Holland, 2013). This struck me as immensely important because of the catastrophic impact that tropical storms can have on the lives and properties of anyone living in a coastal region. It is estimated that the average tropical storm in the US causes between seven and eleven thousand deaths per storm, and tropical storms have accounted for between 3.6 to 5.2 million deaths since 1930 in the U.S. (Garthwaite, 2024).

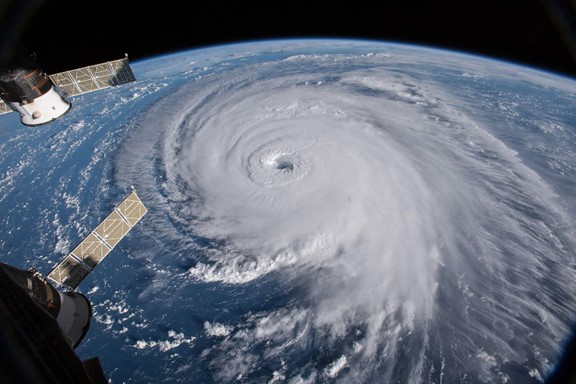
Dramatic View of Hurricane Florence from the International Space Station. Photo: NASA Goddard Space Flight Center, 2024 (CC by 2.0).

The United States is no stranger to tropical storms, and their unpredictability and aggression makes them a daunting task for coastal meteorologists to forecast. Hurricanes are formed as a result of a large amount of water vapor condensing and circulating over warm oceanic areas (Holland, 2014). When water vapor condenses into clouds, it releases large amounts of latent heat, which contributes to the available convective energy in the atmosphere. As the sea surface temperatures rise, the amount of evaporation over the ocean increases and subsequently the amount of available water vapor increases as well. This rise in available water vapor allows for more condensation and latent heat release, which creates a positive feedback relationship that is theorized to be the cause for the increased frequency, intensity, and location of intense hurricanes (Lackman, 2011).

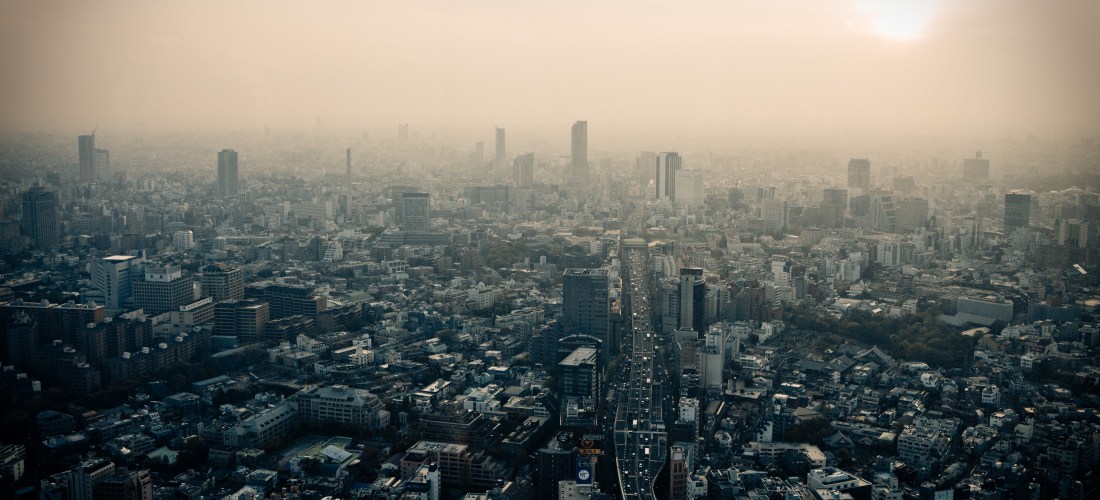
An aerial view of a city showing a smoggy sky above the buildings.

Models: How accurate are they?

Atmospheric Science Students

By Ryleigh Czajkowski

I have always been curious about the weather and climate, as my dad was a pilot and used to teach me little things about the atmosphere. When I entered college, I decided to follow that curiosity by majoring in atmospheric sciences and developed a new interest in air quality along the way. Air quality is an issue that has global effects with potential detrimental impacts, and I would like to find a job that uses scientific understanding of air pollution to make impactful actions and policies. Specifically, I would like to go into pollution modeling and management to help mitigate the effects of pollution on communities and ecosystems.

This interest was sparked during an internship I had last summer as part of NASA’s Student Airborne Research Program (SARP). This experience allowed me to use airborne data to validate the Environmental Protection Agency’s (EPA) Community Multiscale Air Quality Model (CMAQ), to see how accurately the model predicts the concentrations of different pollutants. The CMAQ model works by incorporating meteorological (wind, temperature, etc.), emission, and chemical models to simulate the concentrations of trace gases, particulate matter, and atmospheric pollutants both spatially and temporally (EPA, 2022). 

A group of people standing outside near the tail of a plane with NASA on the tail.
Property of NASA SARP. Credit: Madison Landi.

For my senior capstone project, I will be expanding on my previous research to build a better understanding of the capabilities of the model, as it recently underwent an update in 2022 to improve the meteorological processes and emissions. I will focus on the South Coast Air Basin in California, an area with known, notable air quality issues (Chen, et al., 2020) and the levels of formaldehyde and methane there. Both methane and formaldehyde act as active gases in the atmosphere. With methane concentrations on the rise (Feng, et al., 2023) and formaldehyde as a health and environmental irritant (Lucken, et al., 2018), they are important gases to study and understand. I will be assessing how well the CMAQ model can simulate the concentrations of formaldehyde and methane in the atmosphere, as well as the accuracy of  the meteorological inputs (i.e., wind) as they greatly affect the behavior and amounts of those gasses. (Barsanti, et al., 2019). 

Thunderstruck: Predicting Dry Thunderstorms

Atmospheric Science Students

By Markus Sonnenfeld

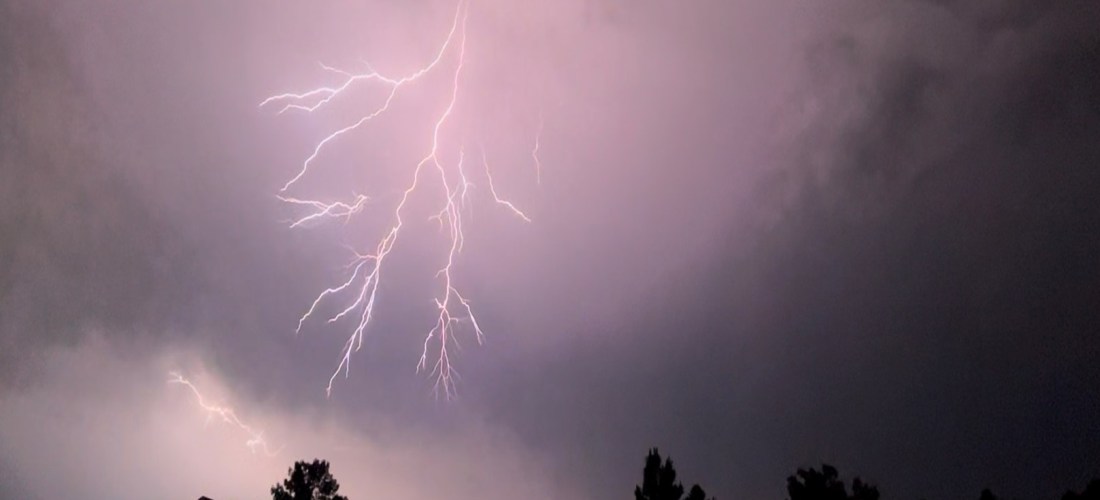
I became increasingly intrigued by wildfires in the western U.S given how crazy the 2020 season was. I have family in both Nevada and California, and the effects of that fire season still have impacts on them today. What I didn’t know at the time was that dry thunderstorms, which produce dry lightning, are a major cause for wildfires in the U.S. A recent example is the August Complex fire in 2020, which burnt about 470,000 acres alone in California, making it the state’s largest wildfire ever. It was created when dry lightning sparked multiple smaller fires that grew into a larger complex of fires. The average cost of fighting wildfires is $1 billion annually with millions of dollars in property loss as well (National Interagency Coordination Center (NICC),ND).

Sunday Gulch in Custer, SD. May 5, 2023. Photo by Markus Sonnenfeld.

Corn: The Carbon Cure?

Atmospheric Science Students, STS Students

By Isaac Kolousek

Growing up on a farm in rural South Dakota, I heard someone say once that no matter how much it rains, a farmer will always complain about it even though deep down they’re grateful for it. This is what helped guide me towards the Atmospheric and Environmental Sciences program at South Dakota Mines after figuring out that my initial degree in Computer Science was not where I wanted to go with my life. I wanted to understand why it did or didn’t rain on our farm, but it rained on our neighbor’s farm. I also wanted to understand why farmers, whose entire lives rest in the hands of the weather, don’t get the focus they deserve when it comes to forecasts.

Heavy dark clouds over green fields.
A supercell rolls over a crop field. This will likely cause damage to the crops through high winds and heavy rain showers. Courtesy: Creative Commons.

Hail Raiser

Atmospheric Science Students, STS Students

By Madisen Lindholm

As a weather lover, I always fangirl when a big storm rolls through. I love going outside or chasing it (safely) and seeing all aspects of the storm. Sometimes before a thunderstorm that will produce hail, mammatus clouds form. Mammatus clouds are bubbly in appearance, and are considered unique, but we often see them in the Black Hills. These are my favorite clouds due to how unique they are and how telling of the storm components they are.

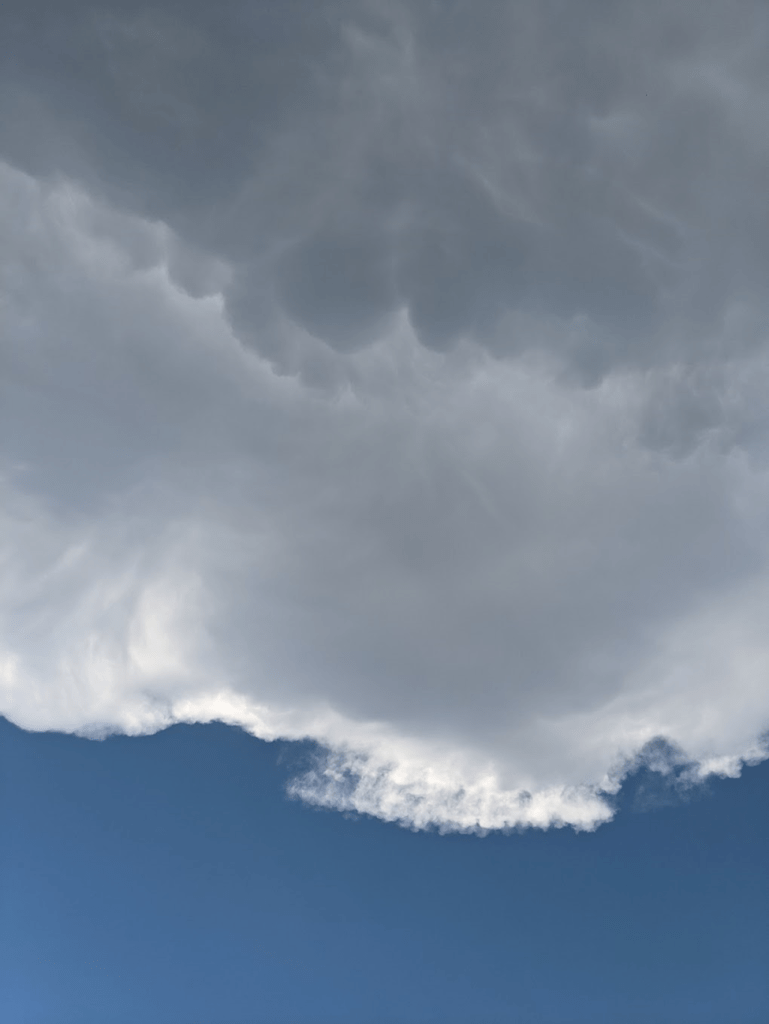
Clouds against a blue sky. The sky is visible at the bottom of the image and above that dark, bubbly mammatus clouds take up most of the image.
This image was taken last summer from Rushmore Crossing. Up at the top of the image are the dark, bubbly mammatus clouds. Mammatus clouds typically foreshadow hail, and are rare in most areas, but are somewhat common during the summer in South Dakota.

I especially love the aftereffects of a thunderstorm. The stillness in the air, the rainbows, the smell of freshly fallen rain, and the glow of the atmosphere are all amazing to me. It also amazes me how much energy storms produce and use as they race across the plains of South Dakota, dropping rain, wind, hail, and lightning as they go. One storm that particularly amazes me is one that occurred on July 23rd, 2010, in Vivian, SD. This storm produced the largest hailstone ever recorded in the United States (3D printed model pictured above). This hailstone is 8 inches in diameter, 18.6 inches in circumference and weighs nearly 2 pounds! Imagine that hitting your house!

Because I have always loved severe weather, I knew my senior research topic needed to be in that category. I especially find hail fascinating, so I decided to use hail as my main topic. South Dakota summer thunderstorms are known for the hail they bring. From car damage, broken windows, roof damage, livestock casualties, plant damage, and human casualties, hail causes many problems. As a lifelong South Dakotan, there have been many times I have been out and about when suddenly I get a National Weather Service emergency warning about hail, but by that point it is too late to move my car into a safe area. Over the years, it has seemed like hail has increased in frequency and size on a regular basis. For example, last summer it seemed like the majority of storms brought at least pea-sized hail, where just a decade ago I remember hail being a more special occurrence. This struck me as an important hypothesis to address because as climate change becomes worse hail will, too, so I figured it would make for an interesting capstone project.

To Dust We Shall Return?

Atmospheric Science Students, STS Students

By Lillian Knudtson

Weather affects all people, and it is important for meteorologists to understand a wide range of events to communicate effectively to the public. My capstone is a project designed to dissect a particularly interesting phenomenon, especially to South Dakota. I have chosen to do a case study of a particular dust storm known as a haboob. The storm I am focusing on occurred May 12th, 2022, and it impacted the eastern part of South Dakota. A widespread, long-lived thunderstorm called a derecho created the haboob beginning in the south central portion of Nebraska and traveled north and east towards Sioux Falls. It sustained winds of 80 miles per hour, and the highest recorded winds of the event were 107 miles per hour. This storm is a good example of what is possible and can become a sample case for the future.

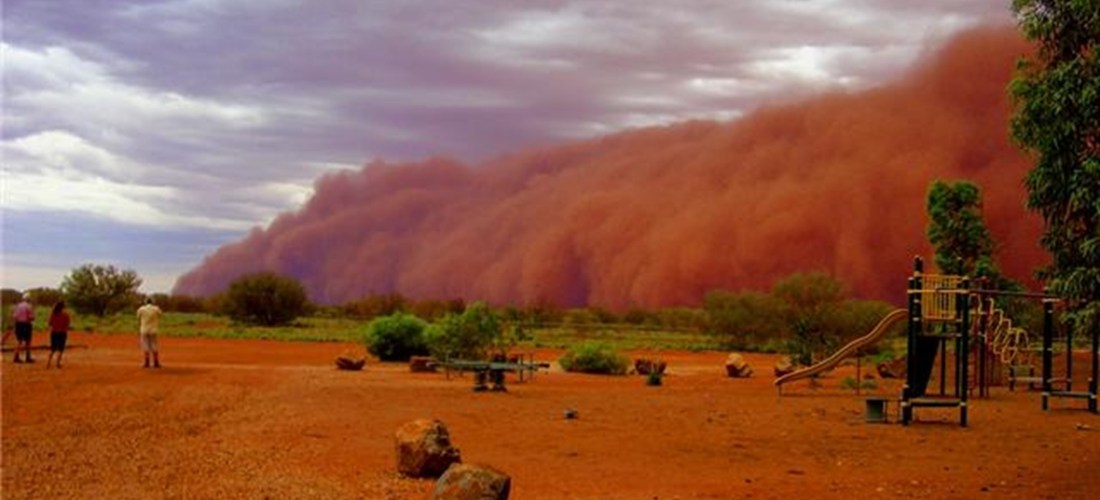
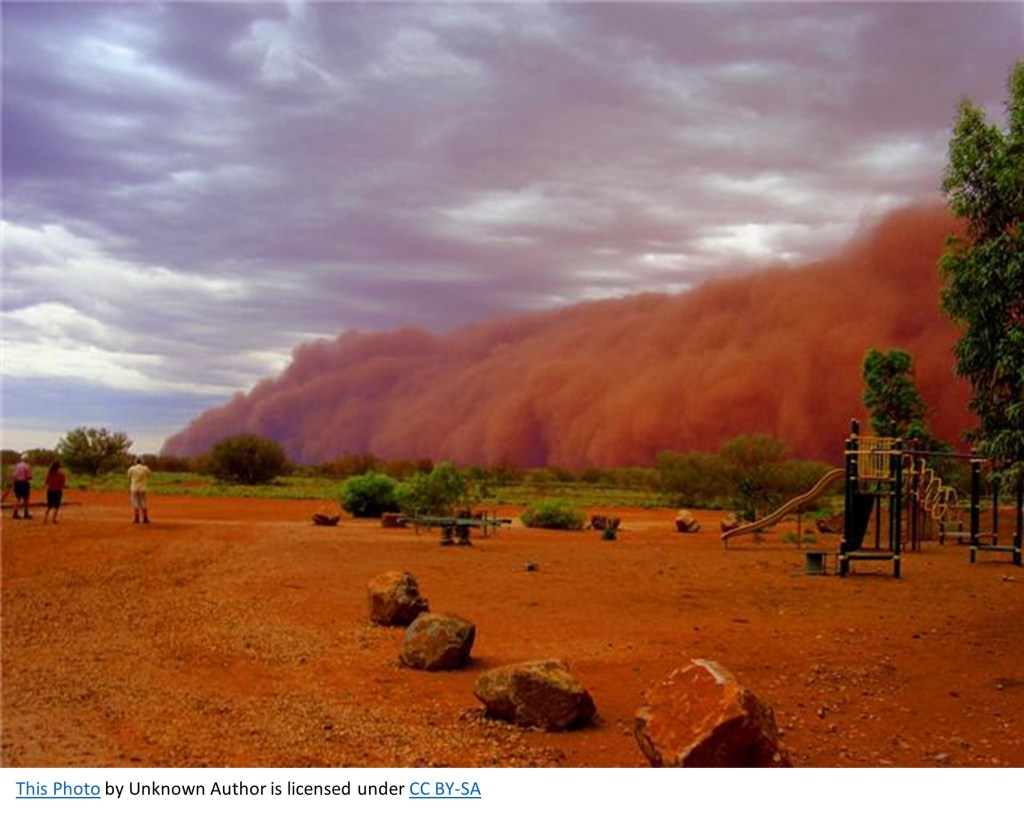
Photo of giant reddish-brown dust cloud blowing in from the right side of the image, approaching a playground and a few people watching it.

A haboob is a giant dust storm. It is named after the Arabic word habb, meaning “blown.” This type of storm is most common in the Middle East and Northern Africa, where is it historically arid. But haboobs are also well known in the Southwestern United States and are becoming an occurrence in previously unlikely places as well. Haboobs are created from loose particles that are picked up by strong winds caused by storms like monsoons or derechos sweeping across the surface of the earth. The massive amount of precipitation associated with these events evaporate, which is a cooling process, so cool air called a gust front accelerates out in front of the storm at a fast rate, picking up particles and building a wall of air and dirt. The particles are mostly less than 10 micrometer pieces of dirt, dust, and sand, but they can be as large as a pea, and the wind can pick up other debris along with it. These walls of air and dirt can reach grow to 5000 feet tall and 100 miles wide, and they can move at 60 miles an hour (Eagar, Herckes, Hartnett, 2016). Overall it is a phenomenon that is quite terrifying.

It Spins Me Right Round: What’s The Big Deal With Tornadoes?

Atmospheric Science Students, Environment, STS Students

By Cory Schultz

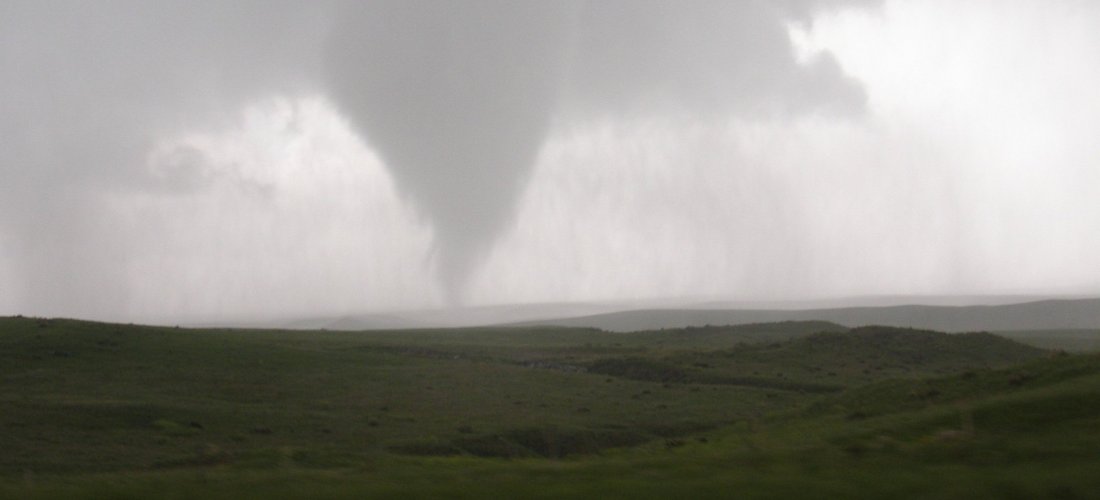
If you look at the annual average number of tornadoes per country, the United States reigns supreme, whether we like it or not. And if we look at South Dakota, the state is not without its share of tornadic activity. For instance, as Dennis Todey, Jay Trobec, and H. Michael Mogil write, “A massive outbreak of tornadoes placed the state in the severe weather record book on the evening of June 24, 2003” (19). On that day, sixty-seven tornadoes touched down over a 6-hour period, a single-state record tornado occurrence.

So, you may be thinking to yourself right now, “I live in the Black Hills region of South Dakota. We don’t have a problem with tornadoes.” Well, what if I told you that tornado activity has increased in the Northern Black Hills of South Dakota in the last decade? This increase in activity is not typical for the Northern Black Hills, since only nine tornadoes have been reported in this region since NOAA started gathering tornado data in 1950. What makes this even more alarming is that, of these nine cases, four have occurred in the last decade. This increase is the focus of my capstone with my two-part research question: Do the Northern Black Hills tornadoes that occurred in 2015, 2018, and 2020 have any similar characteristics to each other? Will this help determine when new tornadoes will form over the same region? 

Map of the Black Hills showing tornado tracks and the strength of the tornadoes. A handful are circled west of Lead, SD.
Map of Northern Black Hills tornado tracks and strengths on the EF scale. Red circles indicate tornadoes being researched for this capstone. Source: National Oceanic and Atmospheric Administration

How Fires Can Create Clouds

Atmospheric Science Students

By Jackson Zito

Jackson is majoring in Atmospheric and Environmental Sciences at South Dakota Mines. He plans on working with wildfires and the development of pyro-cumulus and pyro-cumulonimbus clouds.

When people ask me why I am going to school, I often tell them it’s to get a degree so I can hopefully get a job. After that answer we usually have a conversation like this:

Them: Cool, so what are you learning then? 
Me: Atmospheric and Environmental Sciences. 
They look at me in confusion as if I just spoke a foreign language. 
Me: It’s meteorology. 
Them: Oh, so you’re going to be a weather boy like the one on TV then. 
Me: No, you know there is a lot more you can do with a meteorology degree than just be on the nightly news.
Them: Like what? 
Me: Well, right now I am researching pyro-cumulonimbus clouds. 

Assuming you have a confused look on your face as they often do, let me explain.