Reflections on Service Learning Lessons with Trinity Eco Prayer Park in Dr. Haugtvedt’s Fall 2025 STEM Communication for Public and Technical Audiences Course
Mario Dominguez: Restoring a Prairie, One Volunteer Step at a Time
When our class partnered with Trinity Eco Prayer Park this semester, I expected a simple clean-up project. What I discovered instead was a living example of how small ecological changes can ripple through an entire landscape. One of the most striking lessons came from learning how invasive species, especially Canada thistle, can spread quickly and choke out native grasses. These native plants aren’t just background scenery; they anchor soil, trap moisture, and support insects, birds, and even the microorganisms underground. Removing an invasive patch doesn’t just make the park look nicer, it helps restore the natural cycles that keep the prairie healthy.
Our time in the park also revealed how restoration is as much about people as plants. Every volunteer who pulled weeds or cleared debris added visible progress, but they also became connected to the ecosystem they were helping. Science communication often talks about “ecosystem services,” but seeing the concept firsthand–cleaner soil, healthier growth, and a space that brings peace to visitors–made the science feel personal. Trinity Eco Prayer Park isn’t just a project site; it’s a reminder that anyone can make a meaningful impact when they understand the science behind their actions.
By the end of the semester, our team didn’t just complete a service project, we contributed to a small but powerful example of community-driven ecological restoration. And that’s what I hope others see when they visit the park: a place where science, stewardship, and community come together to revive a prairie one season at a time.
Lucas Geiger
While our team was researching possible alternatives for the Kentucky Bluegrass lawn at Trinity Eco Prayer Park it became clear that the simplest and most sustainable solution could be found right outside of town. We thought that native South Dakota grasses like prairie dropseed, western wheatgrass and buffalo grass are naturally built for the local climate and would be great options for the park’s ideology. In their own ways, they can all handle droughts, bounce back after foot traffic and survive through large temperature swings. Creating a mix of the three seemed like the best option to maximize each species’ strengths and weaknesses. This is contrary to the existing Kentucky Bluegrass which is unable to take care of itself without significant work.
Choosing native grasses for the park isn’t just a design choice, it fits in with the park’s ecological values. These grass species will help improve the existing soil’s health, support the local insect diversity and create a landscape that changes more naturally throughout the year. Our goal for the lawn conversion was to give the park a stronger connection to South Dakota’s natural landscaping by replacing one of the last non-native areas in the park.
Reflections on Service Learning Lessons with Trinity Eco Prayer Park in Dr. Haugtvedt’s Fall 2025 STEM Communication for Public and Technical Audiences Course
Josiah Gibbs
When I first walked into room 206W in the Classroom Building, I was expecting a typical English class. I was not expecting Professor Haugtvedt to outline our main project for the semester as a real-world research project for Trinity Eco Prayer Park in Rapid City, a nonprofit organization. We would not be assigned a prompt. Instead, we would be forming groups and researching problems the park faced, writing first a project proposal, then a recommendation report, then presenting our findings in person to the Board of Trinity Eco Prayer Park.
English assignment? This was more like a senior design project.
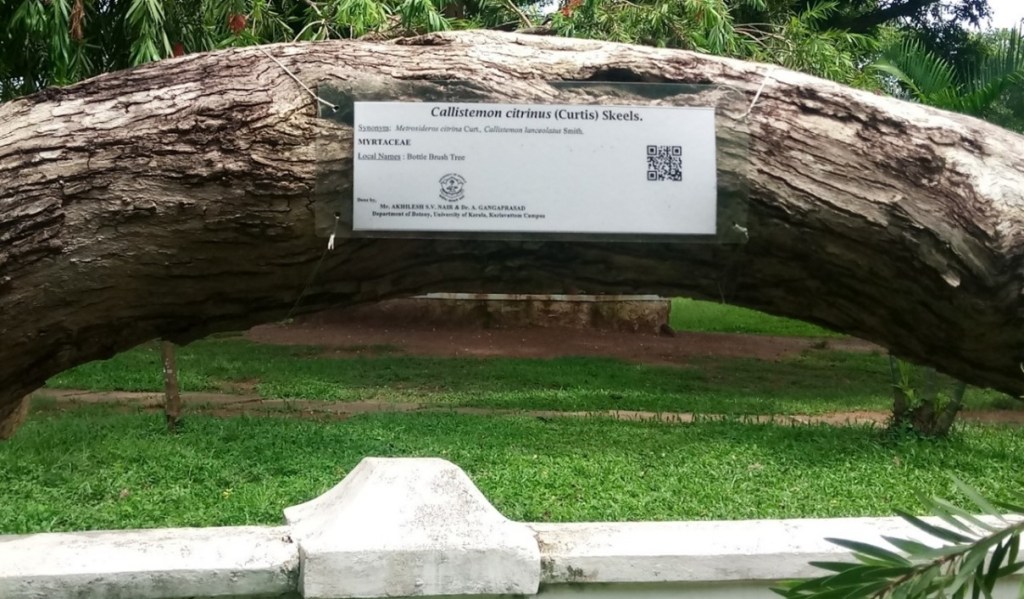
I was suddenly excited. When my team of five chose to research how Trinity Eco could install QR codes in the park, I knew our research would impact the Rapid City community. I also knew that, because this was a real client, the project would prepare me for communicating outside of a college environment. Often, classes are a little too “safe” – isolated from industry – but this class was industry.
Our team had a picture of Trinity Eco’s future – we wanted to research ways to install QR codes. In a normal project, that would be the end of it, but here we had to communicate with our client and make sure our vision lined up with theirs. Part of my role was to talk to the park’s director, Ken Steinken, to clarify our budget and make sure our plans would match Trinity Eco’s own picture of the park’s future. And, with five team members, we had to communicate among ourselves as well. Everyone needed to know their role and communicate their progress to the group. This was all besides our main communication with Trinity Eco: the proposal and the report we were writing. To make a real impact, we had to be able to share information on multiple fronts. The same will be true in a career. With this project behind me, though, I know I can communicate on that level. When I stood in front of Trinity Eco’s Board with my team, describing our plans for QR code installation, I realized we had succeeded – the Board understood our research, and they resonated with it. I’m taking that confidence with me into the future. After this project, I know I can communicate.
Reflections on Service Learning Lessons with Trinity Eco Prayer Park in Dr. Haugtvedt’s Fall 2025 STEM Communication for Public and Technical Audiences Course
Krista Burkman
Service learning is beneficial in many ways, from learning more about a local organization to seeing the impact one person or a group of people can have on a community. The project we completed in Dr. Haugtvedt’s Fall 2025 ENGL 289 does just this. Through working to help the Trinity Eco Prayer Park find potential solutions to one of their problems, I learned how a person or a group of people can have a larger impact on the community than I previously thought.
One of the issues the park is currently facing is finding ways to utilize its website to show off all the park has to offer and recruit donors. I spent time reading articles to learn more about the different audiences the park would like to reach and the content each audience prefers. After compiling all my newfound information, I was able to compose a recommendation for the park board. This included several options for creating strong and effective content for their website, which can also be used on social media platforms if the park were to utilize them.
Even though this may seem like something small, this will help the park improve its website and be more well-rounded when trying to create content to entice viewers. This also helps them gain donors, which then helps the broader Rapid City community. The park may have the funds to continue doing upkeep, general maintenance, and taking on new projects to update or improve the park. The park board’s mission is to bring together people in Rapid City. By maintaining the park and creating a safe environment for residents and visitors of Rapid City, they continue to bring people together and strengthen the community.
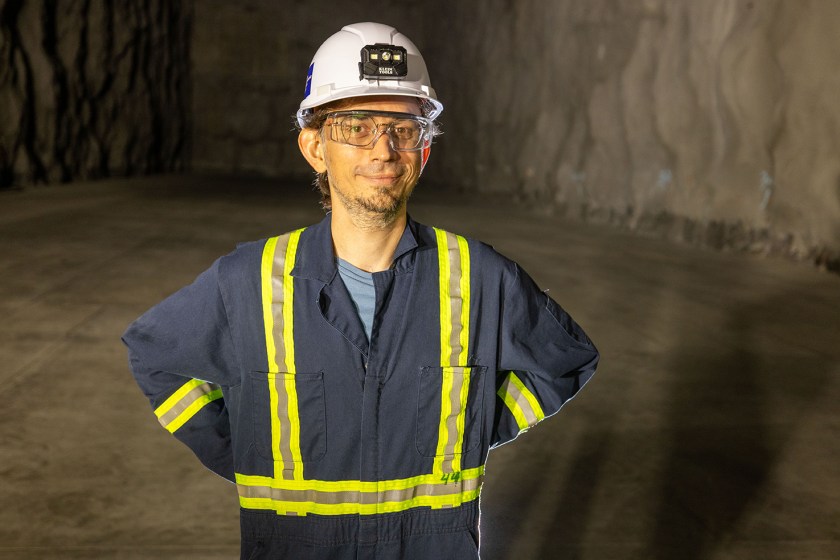
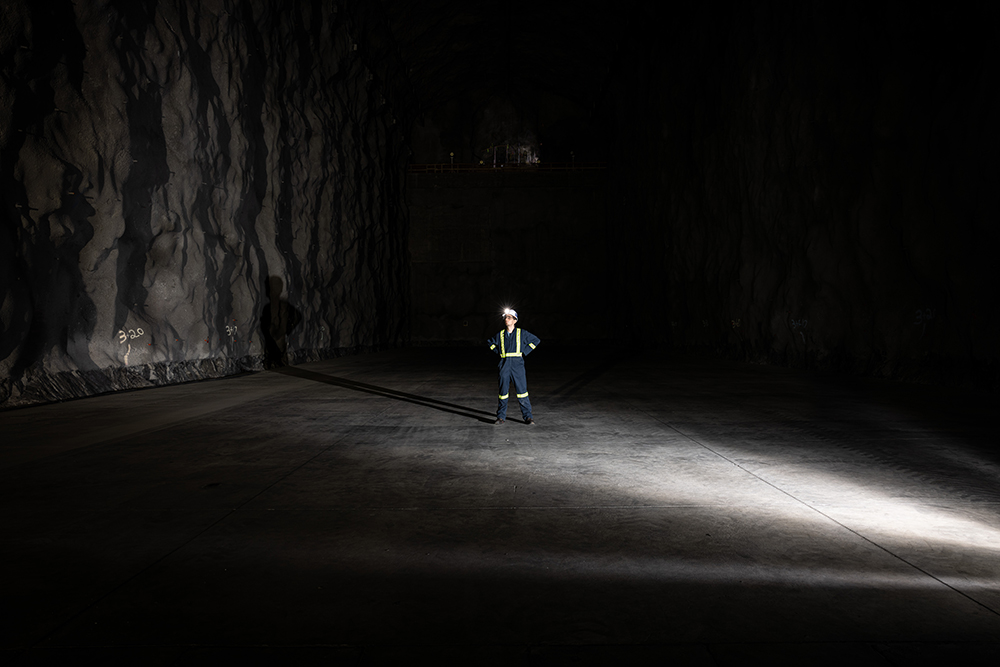
Last summer, Washington, D.C.-based artist Chris Combs swapped his urban studio at the Otis Street Arts Project for one that required a 10-minute open-cage elevator ride, personal protective equipment, and a brass tag etched with his name, indicating his presence nearly a mile underground.
The show will feature interactive, time-based sculptures crafted from found objects, metal, wood and other industrial materials—many of them salvaged during Combs’ time at the Sanford Underground Research Facility (SURF) in Lead. By weaving discarded materials into his work, he aims to echo the layered history of the Homestake Mine and its evolution into a world-class underground laboratory, a dual legacy that drew him to apply for the SURF AiR program.
“I wanted to see firsthand the machinery of particle physics, and the human ‘machinery’ that constructs and maintains it nearly a mile underground in a dusty former gold mine with flood-marked walls,” Comb said. “In my art, I think a lot about how technologies have changed our world, and Homestake/SURF is two rounds of that: first, the transformation of a mountain into 370 miles of tunnels and drifts, and then the transformation of that mine into a container for globe-spanning experiments. The idea of astrophysics occurring a mile underground was very intriguing.”
Photo credit: Stephen Kenny, SURF
Combs creates his pieces with the goal of having audience interaction. “I am lucky to get to make interactive artworks, where pushing a button or inserting a metal ball makes something happen,” he said. “At least for me, actively participating helps me remember it later. This extra little conversation between an artwork and its viewer also offers a challenge and a reward: do you dare to touch the thing? If so, here is an unexpected result. I hope that my artworks reward your curiosity.”
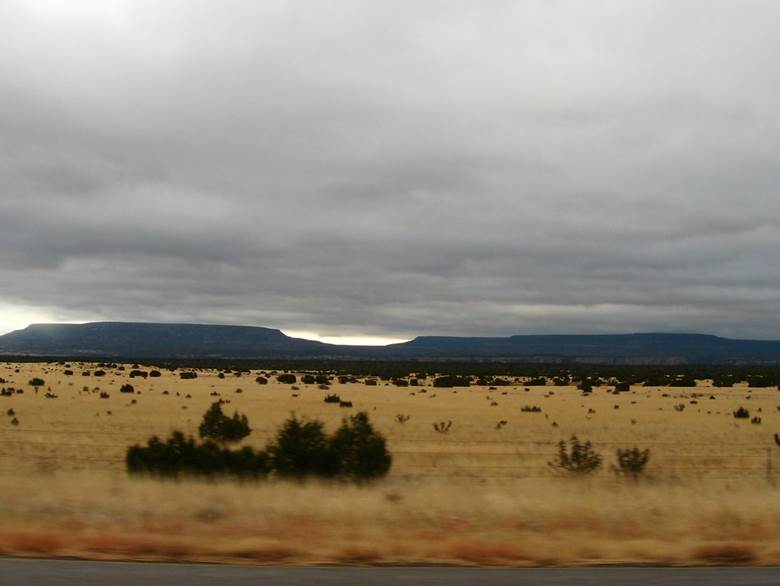
On March 19th, 2003, residents of the Denver Metropolitan area and the adjacent foothills awoke to a winter wonderland. However, instead of thoughts of stressful work commutes and plans for backyard snowball fights, a sense of cabin fever was settling in. This was the third day of one of the largest snowstorms in Denver’s history. According to the National Oceanic and Atmospheric Administration’s (NOAA) National Regional Climate Center snowfall accumulation database, some residents saw up to thirty inches of snow over four days. As a result, thousands of residents were on lockdown without power and unable to leave their homes.
While the March 2003 blizzard was one of the more memorable snowstorms in the past fifty years, Coloradans are familiar with large blizzards and their inevitable consequences. Other notable Denver storms include the Christmas 1982 blizzard that dropped nearly twenty-four inches of snow, and, more recently, the March 2021 “Pi Day” blizzard that buried the Front Range in twenty-seven inches of snow (data courtesy of the Denver/Boulder National Weather Service [NWS] Weather Forecast Office [WFO]). Large snowstorms like these often result in significant road and travel closures, power outages, and property damage, which are difficult to prepare for and a consequence of inaccurate weather forecasting. Yet, despite what many Coloradans believe, the local meteorologists are not at fault. It is the unfortunate reality of living near large mountain ranges, such as the Rocky Mountains, where radar and satellites struggle to track current weather patterns accurately and topography can change conditions on a dime.
Growing up as a Colorado native who has heard the stories of (and even lived through) these intense blizzards, I developed a passion for mountain meteorology and often wonder: how do we improve weather forecasting for the mountainous terrains that make up our colorful state? What can we as meteorologists do to gather accurate information to help major metropolitan areas mitigate impacts? These questions inspired me to choose the topic of my senior capstone project: investigating the patterns associated with mid-latitude cyclones and how they impact snowfall over Metro Denver and the Foothills.
Mid-Latitude Cyclone Over the Midwestern US as seen from the GOES West Satellite. Photo: NOAA Satellites.
As defined by NOAA’s National Environmental Satellite, Data, and Information Service (NESDIS), a mid-latitude cyclone is a low-pressure system that forms between 30° and 60° latitude, including most of the continental United States, excluding the Gulf Coast and Florida. These pressure systems fall on the “synoptic-scale” (NOAA), meaning their size can range from 620 to 1,500 miles, i.e., the size of one state to multiple at once. If you’ve ever looked at a weather map on the news before, you’ve likely seen a mid-latitude cyclone’s familiar “T-Bone” structure (Schultz & Mass). It consists of a red “L” (for the center of the low-pressure zone), a red line with semi-circles (a warm front), followed by a blue line with triangles (a cold front), and occasionally a purple line with alternating semi-circles and triangles (an occluded front). When looking through the lens of thermodynamics and atmospheric physics, a more complex framework appears, including what is referred to as “conveyor belts”: air bands that vary in temperature, moisture, and density (Lackmann). In a mid-latitude situated over the Midwestern United States, air flows counterclockwise around the low-pressure system. As it does so, warm, moist air is pulled from the Gulf, creating the “warm conveyor belt.” Meanwhile, an east-to-west “cold conveyor belt” of cold, moist air forms ahead of the warm front. When these two belts meet, the warm conveyor belt is quickly forced upward, where the air cools and condenses into clouds before falling as precipitation.
Diagram of air conveyor belt relationship with a low-pressure system. Diagram by Kendall Custer.
In my research, I hypothesize that when a mid-latitude cyclone brings blizzard conditions to Denver, the system’s low-pressure center is most likely positioned over southeastern Colorado. Here, the warm and cold conveyor belts have an easterly flow when they reach the eastern slopes of the Rocky Mountains and encounter upslope forcing, a process where topography redirects wind from horizontal to vertical flow. During this, the air is rapidly cooled, condensing into clouds and producing significant snowfall over Denver and the Foothills.
As mentioned earlier, forecasting these large, heavy snowfall events is challenging in regions like Denver, which is why research like mine focusing on the patterns of meteorological processes is essential. Improving the accuracy and timeliness of numerical weather forecasting can prepare residents (i.e., supply stocking), allow government agencies like the Colorado Department of Transportation to prepare roads by dropping sand/magnesium-chloride to prevent icing, and provide time for energy companies such as Excel to plan for power outages. In the end, these preparations not only keep metropolitan areas like Denver operating during large snowstorms but can save Coloradans’ lives, enforcing the necessity of improved weather forecasting and mountain meteorology research.
I am a Senior Atmospheric and Environmental Science Major with a Meteorology Specialization and a minor in Mathematics. The question of when I first became interested in the weather is greatly debated in my household, ranging from me searching our yard every day for fallen weather balloons after a local TV meteorologist visited my elementary school to when I would beg my dad to pull over so I could take a photo of a cool cloud. Regardless, every childhood fascination with something weather-related led me to today, where I have developed a passion for synoptic-scale meteorology, cyclogenesis, mountain meteorology, severe weather, and investigating the unknown. After graduation, I plan to continue my education by earning my master’s degree, ideally internationally (fingers crossed!), and eventually working in my dream career as an atmospheric researcher. When my head is not in the clouds or my textbooks, I enjoy a range of hobbies, including creative writing, arts/crafts, paddleboarding/hiking with my dog Hershey, and powerlifting.
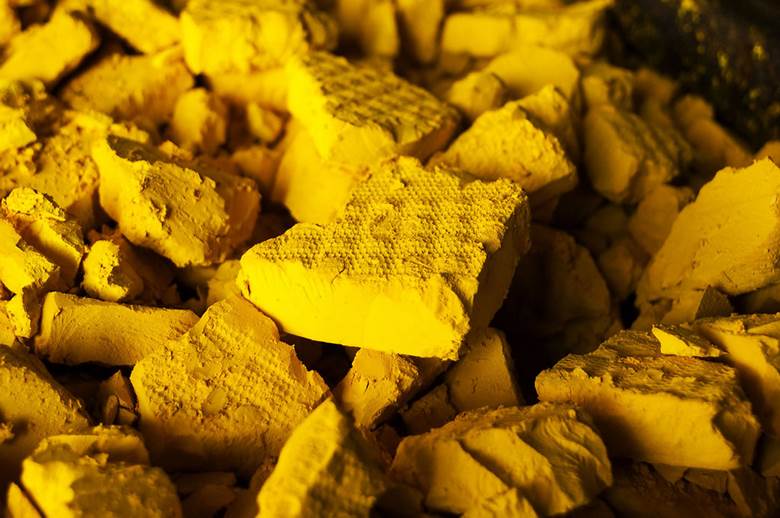
In the 1970s, my grandfather lived in western New Mexico, where he worked in the uranium mining industry. He has shared countless stories about his experiences working there. Since working there, he’s faced many health challenges, including losing a kidney to cancer. It was not until after working there that he learned he had developed health issues, likely due to working in poor and unsafe conditions. After learning about his personal experiences, it led me to ask the question of “why has this happened? And to whom else?”
New Mexico has long been a prime region for mining operations. Western New Mexico lies within the Colorado Plateau, a region that spans the Four Corners states. In the early 1940s, as the United States was in the height of World War II, there was a sharp uptick in uranium production as the federal government had initiated the Manhattan Project. The United States raced to create the key to victory in the war, the Little Boy, which was a uranium-235 atomic bomb that would eventually be dropped on Hiroshima. As part of the Manhattan Project, the United States government created the Atomic Energy Commission, which largely oversaw the production and development of nuclear energy and nuclear weapons, which included uranium mining. (Ringholz & Notarianni, 2006)
In the region where mining operations were taking off at an incredibly fast rate, it was bringing economic opportunity to the area and many members of the Navajo nation began to take up employment opportunities at many of these operations (Ringholz & Notarianni, 2006). In northwest New Mexico, where my grandfather resided, there were many mining operations. Researchers who surveyed the working conditions at these mines were alarmed at the levels of dangerous exposure the miners were experiencing, and began voicing their concerns (Ringholz & Notarianni, 2006).
For example, a notable problematic site was the Church Rock Uranium Mill. This mine was in operation from 1967 until 1982. During its operation, this mill processed around 3.5 million tons of uranium ore. Due to poor practices and the failure of the temporary uranium mills tailings disposal pond, around 1,100 tons of uranium waste and 94 million gallons of radioactive water seeped into the nearby Puerco River (US EPA, 2023). In 1982, the mining site was declared a Superfund Site by the United States Environmental Protection Agency. Yet, to this day, one of the top environmental issues in the region is groundwater contamination.
There are many questions which stem from these events. How do we fix these issues? What can we learn from these events? These questions are extremely important to investigate; however, we cannot always plan for the future by looking at past problems. I believe a better way to approach this part of environmental justice would be to ask “how do we hold mining companies accountable?” and “how is justice being served?”
This is why for my senior capstone I will be looking into answering these questions. Many past employees of these mining operations, including members of my own family, have been and are still currently impacted by poor practices. I strongly believe that more research is necessary to promote the health and wellbeing of all individuals impacted by the mining industry.
References
Ringholz, R. C., & Notarianni, P. F. (2006). Uranium Boom. In C. Whitley (Ed.), From theGround Up: A History of Mining in Utah (pp. 142–165). University Press of Colorado. https://doi.org/10.2307/j.ctt4cgn2r.13
US EPA, R. 09. (2023, August 10). Old Church Rock Mine. Www.epa.gov.
I am a senior at South Dakota Mines studying both Atmospheric & Environmental Sciences and Science, Technology, & Society. I was born and raised in South Dakota. Growing up, I was fascinated with the weather, spending my summers watching thunderstorms roll across the Great Plains. My love for weather pushed me to pursue further education at South Dakota Mines. During my time in school, I have developed a passion for law and policy, which has led me to focus my education on environmental issues. After college, I plan to attend either graduate school or law school. In my free time, I enjoy lifting and running, playing the piano, and hiking. In the spring and summer months, I enjoy a good storm chase, where I continue to be in awe of the thunderstorms in the Great Plains. I also enjoy spending time with my family, as my research project is inspired by the stories I’ve been told over the years.
Sometimes people assume that engineers aren’t creative, but this is far from the truth, as the current Apex Gallery exhibit of dinosaur marionettes shows. In his introduction to mechanical engineering course, Dr. Cristian Vargas Ordóñez (in collaboration with Matt Whitehead, Senior Instructor of Art and Director of the Apex Gallery) asked students work in teams to use the engineering concepts they were learning to create and present large dinosaur marionettes.
This project shows what’s possible within engineering education and at the intersection of arts and engineering. It’s also a great illustration of a core principle of STS, which attends to how knowledge is created. Javier Lezaun, Noortje Marres, and Manuel Tironi write that “the larger aim of STS research and intervention . . . [is] to activate new collective imaginations of what an epistemically, technically, environmentally and materially engaged polity might be.” Working together as teams to create something new is a version of this aim at the scale of a college classroom, and it’s good practice for STS thinking and for working creatively with others in other areas! (Our Creativity and Collaboration in STEM minor further reinforces these connections.)
More details about the art exhibit are included in the press release below, and the marionettes will be on display in the Apex Gallery this week, with a reception this afternoon (Wednesday, 11/19) from 4-6 pm.
Art Exhibit Features Giant Dinosaur Marionettes Designed by Mines Mechanical Engineering Students
RAPID CITY, SD (Nov. 19, 2025) – South Dakota Mines mechanical engineering students brought engineering and imagination together to build large dinosaur marionettes, each one crafted with a variety of materials ranging from papier-mache and fabric to metal and 3D printed parts and designed with at least two movable parts.
The creatures are now on display in the Apex Gallery in the university’s Classroom Building. The project is part of the freshman introduction to mechanical engineering course taught by Cristian Vargas Ordóñez, Ph.D., assistant professor in the Leslie A. Rose Department of Mechanical Engineering.
Dr. Vargas Ordóñez in the Apex Gallery with the dinosaur marionettes.
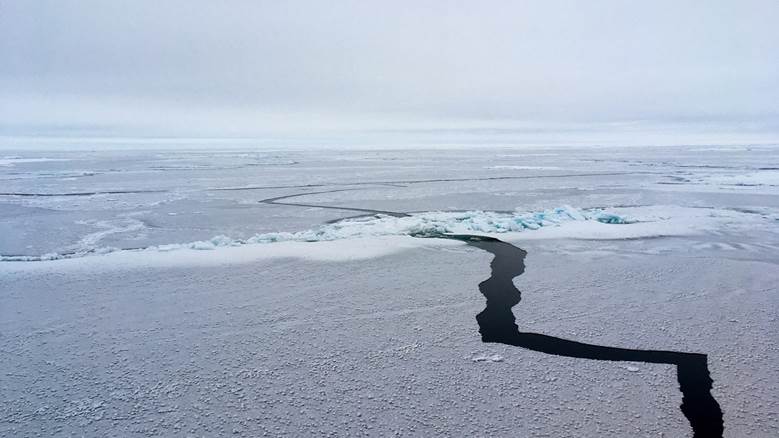
Did you know that sea ice, especially in the Arctic, is forecasted just like the weather? It turns out that sea ice is both a significant tool and obstacle for people residing in areas of the Arctic circle, subsistence hunters, ships looking to navigate through the Arctic passages, and people studying the climatology of the Arctic tundra. So, yes – it’s a little bit important to understand how ice is changing, moving, and behaving daily. Although a lot of work is done to collect data about ice through physical measurements and buoy tracking, satellites play a major role in monitoring the conditions of ice. The only drawback with satellites is that many of them are unable to take readings at night and though clouds (for example, the NOAA – 20 Visual Infrared Imaging Radiometer Suite (VIIRS)), which proves an issue on many days, especially during the Arctic winter when the North Pole is cast in 24-hour darkness.
How can we go about navigating this issue? Although most of the Arctic circle freezes up during winter, thus limiting shipping operations, being able to make ice forecasts is still vital to residents of the area, local tribal nations, climate records, and subsistence hunters. The specific variable of interest for this project is sea ice concentration, which is defined as the understanding of the percentile of ice present. For example, an 80% ice concentration means that there is an 80% chance that ice is present in that area – it has nothing to do with ice depth, thickness, or extent. Understanding sea ice concentrations is especially important during the spring and summer seasons, when monitoring areas where the ice edge meets ocean water becomes both difficult and an active threat to human safety. But… if satellites can’t tell us this information all year long, and buoys may not be a feasible option for continuous monitoring, what can we do?
This summer, I had the privilege of studying with ice scientists at the National Atmospheric Ocean Administration (NOAA) as a recipient of the Ernest F. Hollings student scholarship and internship program. I have family members who have worked in Alaska, Greenland, and Antarctica, which sparked my interest in studying polar meteorology and climatology. So, when I got to choose what research to do, it made the most sense for me to work on something that dealt with monitoring ice changes. I quickly became indoctrinated into the world of ice forecasting as a novice researcher with one primary goal: find a way to consistently monitor sea ice concentration for ice forecasting.
Our primary satellite products that we have been using as tools for our research are the Synthetic Aperture Radar (SAR), the NOAA – 20 Visual Infrared Imaging Radiometer Suite (VIIRS) sea ice concentration product, and an AI product by the title of IceLynx. IceLynx is trained purely off the data received by SAR, and SAR is essentially just a radar in space that shoots down lasers and creates an image based on the roughness of the surface the laser just hit. The upside to SAR is that it is not inhabited by lack of light or clouds, making it the perfect instrument for continuous sea ice concentration.
You may be thinking, Wow! If SAR can do all of that, why do we even need to do this research? Unfortunately, SAR sometimes gets things wrong. Sometimes, it can mistake rough winds on the surface of the ocean like ice. Or it can make mistakes with puddles that form on the top of ice as they melt as areas of open water. This problematic phenomenon is known as “tone reversal,” which makes SAR backscatter values rather difficult to interpret. For example, what if ice forecasters were to tell a shipping vessel there was a big patch of open water, when there is a thick sheet of ice with a few inches of melting water on top? Dangerous consequences may ensue. Since the IceLynx AI product is trained only off SAR, it is prone to inaccurate readings as well, wasting the time and energy of the ice forecasters.
A real Normalized Radar Cross Section (NCRS) of SAR data from October 29th, 2025. This is an active example of the data we are working with. Each greyish to black pixel that is present in areas of the Arctic Ocean is a different backscatter value displayed by the surface roughness read in by SAR. NOAA CoastWatch L1/L2 Spatial Search.
So, the primary goal of our research is the following: if we can derive a relationship between the SAR backscatter values and true sea ice concentrations from the VIIRS data, then we may be better able to navigate the issue of tone reversal and help retrain various AI products as well as inform ice forecasters what to look out for when tone reversal is occurring. If we can complete our goal utilizing ArcGIS Pro to parse through our satellite data and start examining statistical relationships that occur between certain backscatter values and sea ice concentrations, then we may be able to help the ice forecasters around the globe stop asking themselves: “Where the heck is the ice?”
Ryenne “Rye” C. Julian is a senior Atmospheric and Environmental Sciences (AES) undergraduate student set to graduate in December of 2026. They have had a variety of internship opportunities working with topics such as small-scale climate research, helping to write a climate action plan, studying micrometeorology and agrivoltaics, and most recently, studying how applied remote sensing methods can be used to study sea ice and better train ice forecasting AI programs with the National Oceanic and Atmospheric Administration (NOAA). Her passion for the study of ice came from the start of her undergraduate degree being spent at Northland College as a climatology student before transferring to South Dakota Mines in 2024 because of Northland College’s closure. At SD Mines they have been able to apply both meteorological and climatological methods to their studies.
Did you know that the Dilophosaurus wasn’t actually able to spit venom and was about 8 feet tall in real life? I sure didn’t until I was around 14, when I started doing more research on dinosaurs. Growing up, dinosaurs were my biggest passion. The first movie I remember watching was Jurassic Park (1993). Until my freshman year of college, my dream was to be a paleontologist; that’s even how I ended up at South Dakota Mines. However, things changed during the 2nd semester of my freshman year, when that route didn’t really fit me. That’s when I discovered STS through a friend and then later found my passion for the law. However, I felt it would be poetic to bring my studies full circle and do a project on paleontology. Therefore, my project will be an analysis of the ethics behind the misrepresentation of paleontology in science fiction films. I want to research this because of my passion for dinosaurs and how I believe we should all learn to love the current interpretations of dinosaurs versus the monster movie showbiz they are portrayed as.
Restoration of Early Jurassic environment preserved at the SGDS, with the theropod Dilophosaurus wetherilli in bird-like resting pose, demonstrating the manufacture of SGDS.18.T1 resting trace. Heather Kyoht Luterman, CC BY 2.5 https://creativecommons.org/licenses/by/2.5, via Wikimedia Commons.
From the 1960s to the 1990s, interest in dinosaur science increased. This was dubbed the “dinosaur renaissance” by Robert T. Bakker in 1975 (Chambers and McCahey, 2024). This then gave birth to a lot of dinosaur science fiction, the most famous being Jurassic Park. One of the things that these films have done is create a misrepresentation of the science and scientists behind them, such as portraying paleontologists as action heroes and depicting dinosaurs, like the Dilophosaurus, in a way that bears little resemblance to their real-life counterparts. To make the films more interesting, they have to add fictional details that would go against modern science, adding features that were never true. This has gotten to the point that a very select few people (that I have personally seen in comment sections) claim their favourite dinosaur is the Indominus Rex from Jurassic World (2015). For reference, the Indominus Rex was a hybrid of a few existing dinosaurs and does not exist in the scientific world.
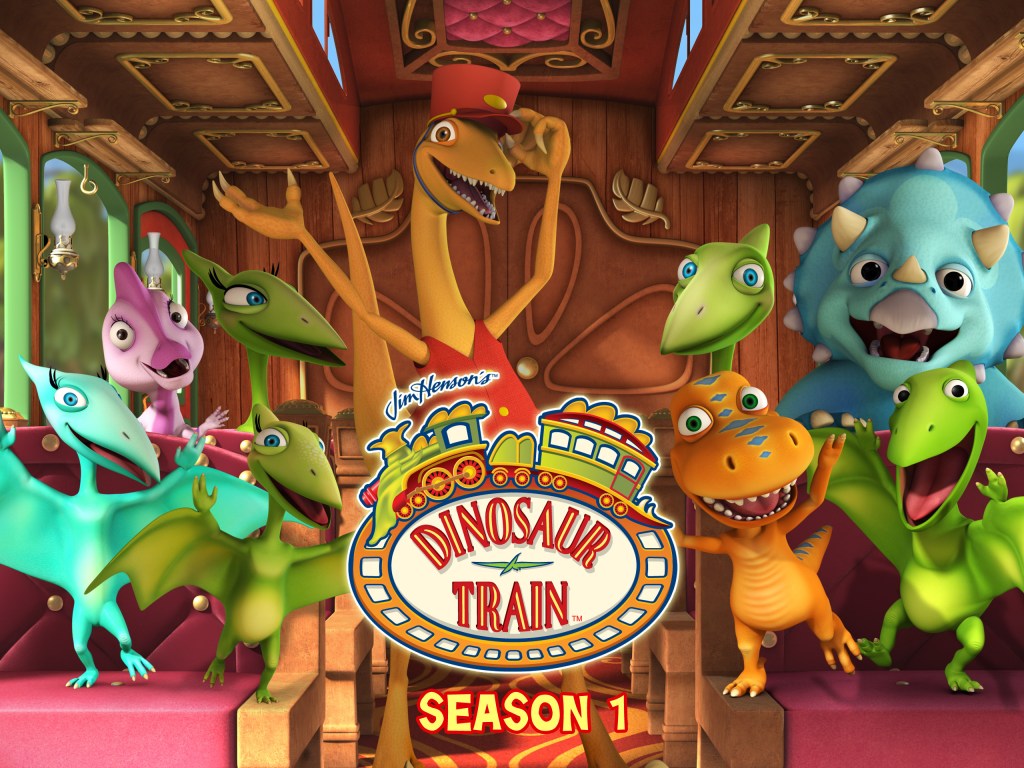
Furthermore, there are many areas in the paleontological world where there hasn’t been great communication between scientists and the popular media. As a result, the media has grown to not always be able to distinguish between the speculative side of paleontology versus the factual side. For example, a species called the Troodon was classified as a dinosaur based on a single tooth. This species then got featured in movies and games alike due to its popularity among popculture. However, in 2017, Troodon was no longer seen as a valid species, as there was too little information to go on and too many similarities to other dinosaurs (University of Alberta, 2017). Even though this occurred, the news never reached the media and Troodon is still being used in the media and sold as toys.
Jurassic Park‘s venom-spitting Dilophosaurus.Kids TV show Dinosaur Train, featuring Troodon as the train conductor.
Overall, I will be taking a look at prehistoric films to keep the project narrower, as expanding to other media like paleoarts or video games would make it too broad. However, this brings me back to my primary research question: why is the misrepresentation of dinosaur science important? It is important because these films can impact the public understanding of science, lead to an eventual lack of respect for scientific labor and credibility, and change the popular view of paleontology.
References
Chambers, A. C., & McCahey, D. (2024). 1990s dinomania: Public and popular cultures of palaeontology from Jurassic Park to Friends. Interdisciplinary Science Reviews, 49(3–4), 410–423. https://doi.org/10.1177/03080188241233121
For our third annual STS Halloween costume contest, we got some great entries! It’s always fun to see how creative South Dakota Mines students can be, and this year was no exception. We were also very pleased to get some entries from faculty and staff this year, too!
Our team of judges loved all of the entries and – based on the prizes we had available to give – selected winners in a variety of categories: Best Original Costume, Best Media Character Costume, Best Simple-But-Effective Costume, Best Group Costume, Best School Spirit, and Best Faculty/Staff Costume.
We’re looking forward to seeing more creative, fun, and spooky costumes next Halloween!