We’re Off to See the Blizzard!

Atmospheric Science Students

By Kendall Custer

On March 19th, 2003, residents of the Denver Metropolitan area and the adjacent foothills awoke to a winter wonderland. However, instead of thoughts of stressful work commutes and plans for backyard snowball fights, a sense of cabin fever was settling in. This was the third day of one of the largest snowstorms in Denver’s history. According to the National Oceanic and Atmospheric Administration’s (NOAA) National Regional Climate Center snowfall accumulation database, some residents saw up to thirty inches of snow over four days. As a result, thousands of residents were on lockdown without power and unable to leave their homes.

While the March 2003 blizzard was one of the more memorable snowstorms in the past fifty years, Coloradans are familiar with large blizzards and their inevitable consequences. Other notable Denver storms include the Christmas 1982 blizzard that dropped nearly twenty-four inches of snow, and, more recently, the March 2021 “Pi Day” blizzard that buried the Front Range in twenty-seven inches of snow (data courtesy of the Denver/Boulder National Weather Service [NWS] Weather Forecast Office [WFO]). Large snowstorms like these often result in significant road and travel closures, power outages, and property damage, which are difficult to prepare for and a consequence of inaccurate weather forecasting. Yet, despite what many Coloradans believe, the local meteorologists are not at fault. It is the unfortunate reality of living near large mountain ranges, such as the Rocky Mountains, where radar and satellites struggle to track current weather patterns accurately and topography can change conditions on a dime.

Growing up as a Colorado native who has heard the stories of (and even lived through) these intense blizzards, I developed a passion for mountain meteorology and often wonder: how do we improve weather forecasting for the mountainous terrains that make up our colorful state? What can we as meteorologists do to gather accurate information to help major metropolitan areas mitigate impacts? These questions inspired me to choose the topic of my senior capstone project: investigating the patterns associated with mid-latitude cyclones and how they impact snowfall over Metro Denver and the Foothills.

Mid-Latitude Cyclone Over the Midwestern US as seen from the GOES West Satellite. Photo: NOAA Satellites.

As defined by NOAA’s National Environmental Satellite, Data, and Information Service (NESDIS), a mid-latitude cyclone is a low-pressure system that forms between 30° and 60° latitude, including most of the continental United States, excluding the Gulf Coast and Florida. These pressure systems fall on the “synoptic-scale” (NOAA), meaning their size can range from 620 to 1,500 miles, i.e., the size of one state to multiple at once. If you’ve ever looked at a weather map on the news before, you’ve likely seen a mid-latitude cyclone’s familiar “T-Bone” structure (Schultz & Mass). It consists of a red “L” (for the center of the low-pressure zone), a red line with semi-circles (a warm front), followed by a blue line with triangles (a cold front), and occasionally a purple line with alternating semi-circles and triangles (an occluded front). When looking through the lens of thermodynamics and atmospheric physics, a more complex framework appears, including what is referred to as “conveyor belts”: air bands that vary in temperature, moisture, and density (Lackmann). In a mid-latitude situated over the Midwestern United States, air flows counterclockwise around the low-pressure system. As it does so, warm, moist air is pulled from the Gulf, creating the “warm conveyor belt.” Meanwhile, an east-to-west “cold conveyor belt” of cold, moist air forms ahead of the warm front. When these two belts meet, the warm conveyor belt is quickly forced upward, where the air cools and condenses into clouds before falling as precipitation.

Diagram of air conveyor belt relationship with a low-pressure system. Diagram by Kendall Custer.

In my research, I hypothesize that when a mid-latitude cyclone brings blizzard conditions to Denver, the system’s low-pressure center is most likely positioned over southeastern Colorado. Here, the warm and cold conveyor belts have an easterly flow when they reach the eastern slopes of the Rocky Mountains and encounter upslope forcing, a process where topography redirects wind from horizontal to vertical flow. During this, the air is rapidly cooled, condensing into clouds and producing significant snowfall over Denver and the Foothills.

As mentioned earlier, forecasting these large, heavy snowfall events is challenging in regions like Denver, which is why research like mine focusing on the patterns of meteorological processes is essential. Improving the accuracy and timeliness of numerical weather forecasting can prepare residents (i.e., supply stocking), allow government agencies like the Colorado Department of Transportation to prepare roads by dropping sand/magnesium-chloride to prevent icing, and provide time for energy companies such as Excel to plan for power outages. In the end, these preparations not only keep metropolitan areas like Denver operating during large snowstorms but can save Coloradans’ lives, enforcing the necessity of improved weather forecasting and mountain meteorology research.

References

Denver/Boulder Weather Forecasting Office. (n.d.). Denver’s Fall/Winter/Spring Statistics. National Weather Service. https://www.weather.gov/bou/DenverFallWinterStatistics.

Lackmann, G. (2011). Midlatitude Synoptic Meteorology: Dynamics, Analysis, and Forecasting. American Meteorological Society.

NESDIS. (2018, June 22). Mid-Latitude Cyclone on the First Day of Summer. NOAA. https://www.nesdis.noaa.gov/news/mid-latitude-cyclone-the-first-day-of-summer.

NOAA Satellites. (2019). Powerful Storm System Seen by GOES West [Photograph]. NOAA. https://www.flickr.com/photos/125201706@N06/47380253391.

Schultz, D. M., & Mass, C. F. (1993). The Occlusion Process in a Midlatitude Cyclone over Land. Monthly Weather Review, 121(4), 918-940. https://doi.org/10.1175/1520-0493(1993)121%3C0918:TOPIAM%3E2.0.CO;2.

Synoptic Meteorology. (2023, May 16). NOAA. https://www.noaa.gov/jetstream/synoptic.


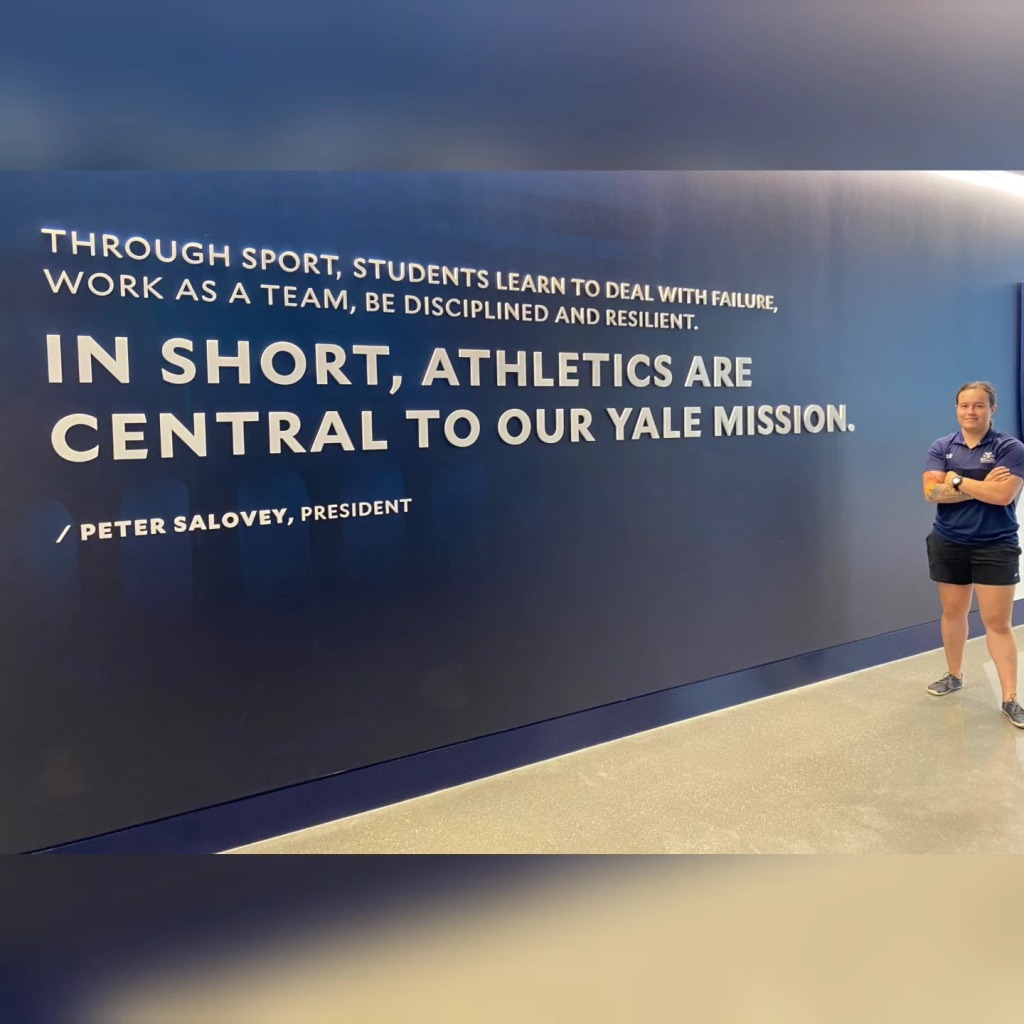
I am a Senior Atmospheric and Environmental Science Major with a Meteorology Specialization and a minor in Mathematics. The question of when I first became interested in the weather is greatly debated in my household, ranging from me searching our yard every day for fallen weather balloons after a local TV meteorologist visited my elementary school to when I would beg my dad to pull over so I could take a photo of a cool cloud. Regardless, every childhood fascination with something weather-related led me to today, where I have developed a passion for synoptic-scale meteorology, cyclogenesis, mountain meteorology, severe weather, and investigating the unknown. After graduation, I plan to continue my education by earning my master’s degree, ideally internationally (fingers crossed!), and eventually working in my dream career as an atmospheric researcher. When my head is not in the clouds or my textbooks, I enjoy a range of hobbies, including creative writing, arts/crafts, paddleboarding/hiking with my dog Hershey, and powerlifting.

Unseen Impacts: Lasting Health Effects on Uranium Miners in Western New Mexico

Atmospheric Science Students, STS Students

By Colin Gholson

In the 1970s, my grandfather lived in western New Mexico, where he worked in the uranium mining industry. He has shared countless stories about his experiences working there. Since working there, he’s faced many health challenges, including losing a kidney to cancer. It was not until after working there that he learned he had developed health issues, likely due to working in poor and unsafe conditions. After learning about his personal experiences, it led me to ask the question of “why has this happened? And to whom else?”

“View of Bluffs and Buttes to the East from S.R. 53 South of Grants, New Mexico” by Ken Lund is licensed under CC BY-SA 2.0. To view a copy of this license, visit https://creativecommons.org/licenses/by-sa/2.0/?ref=openverse.

New Mexico has long been a prime region for mining operations. Western New Mexico lies within the Colorado Plateau, a region that spans the Four Corners states. In the early 1940s, as the United States was in the height of World War II, there was a sharp uptick in uranium production as the federal government had initiated the Manhattan Project. The United States raced to create the key to victory in the war, the Little Boy, which was a uranium-235 atomic bomb that would eventually be dropped on Hiroshima. As part of the Manhattan Project, the United States government created the Atomic Energy Commission, which largely oversaw the production and development of nuclear energy and nuclear weapons, which included uranium mining. (Ringholz & Notarianni, 2006)

“A photo of yellow cake uranium, a solid form of uranium” by NRCgov is licensed under CC BY 2.0. To view a copy of this license, visit https://creativecommons.org/licenses/by/2.0/?ref=openverse.

In the region where mining operations were taking off at an incredibly fast rate, it was bringing economic opportunity to the area and many members of the Navajo nation began to take up employment opportunities at many of these operations (Ringholz & Notarianni, 2006). In northwest New Mexico, where my grandfather resided, there were many mining operations. Researchers who surveyed the working conditions at these mines were alarmed at the levels of dangerous exposure the miners were experiencing, and began voicing their concerns (Ringholz & Notarianni, 2006).

For example, a notable problematic site was the Church Rock Uranium Mill. This mine was in operation from 1967 until 1982. During its operation, this mill processed around 3.5 million tons of uranium ore. Due to poor practices and the failure of the temporary uranium mills tailings disposal pond, around 1,100 tons of uranium waste and 94 million gallons of radioactive water seeped into the nearby Puerco River (US EPA, 2023). In 1982, the mining site was declared a Superfund Site by the United States Environmental Protection Agency. Yet, to this day, one of the top environmental issues in the region is groundwater contamination.

“Laguna Pueblo, New Mexico, as seen from I-40” by Ken Lund is licensed under CC BY-SA 2.0. To view a copy of this license, visit https://creativecommons.org/licenses/by-sa/2.0/?ref=openverse.

There are many questions which stem from these events. How do we fix these issues? What can we learn from these events? These questions are extremely important to investigate; however, we cannot always plan for the future by looking at past problems. I believe a better way to approach this part of environmental justice would be to ask “how do we hold mining companies accountable?” and “how is justice being served?”

This is why for my senior capstone I will be looking into answering these questions. Many past employees of these mining operations, including members of my own family, have been and are still currently impacted by poor practices. I strongly believe that more research is necessary to promote the health and wellbeing of all individuals impacted by the mining industry.

References

Ringholz, R. C., & Notarianni, P. F. (2006). Uranium Boom. In C. Whitley (Ed.), From the Ground Up: A History of Mining in Utah (pp. 142–165). University Press of Colorado. https://doi.org/10.2307/j.ctt4cgn2r.13

US EPA, R. 09. (2023, August 10). Old Church Rock Mine. Www.epa.gov.


I am a senior at South Dakota Mines studying both Atmospheric & Environmental Sciences and Science, Technology, & Society. I was born and raised in South Dakota. Growing up, I was fascinated with the weather, spending my summers watching thunderstorms roll across the Great Plains. My love for weather pushed me to pursue further education at South Dakota Mines. During my time in school, I have developed a passion for law and policy, which has led me to focus my education on environmental issues. After college, I plan to attend either graduate school or law school. In my free time, I enjoy lifting and running, playing the piano, and hiking. In the spring and summer months, I enjoy a good storm chase, where I continue to be in awe of the thunderstorms in the Great Plains. I also enjoy spending time with my family, as my research project is inspired by the stories I’ve been told over the years.

Where the Heck Is the Ice? Deriving Arctic Sea Ice Concentrations Using Remote Sensing Methods

Atmospheric Science Students

By Ryenne “Rye” Julian

Did you know that sea ice, especially in the Arctic, is forecasted just like the weather? It turns out that sea ice is both a significant tool and obstacle for people residing in areas of the Arctic circle, subsistence hunters, ships looking to navigate through the Arctic passages, and people studying the climatology of the Arctic tundra. So, yes – it’s a little bit important to understand how ice is changing, moving, and behaving daily. Although a lot of work is done to collect data about ice through physical measurements and buoy tracking, satellites play a major role in monitoring the conditions of ice. The only drawback with satellites is that many of them are unable to take readings at night and though clouds (for example, the NOAA – 20 Visual Infrared Imaging Radiometer Suite (VIIRS)), which proves an issue on many days, especially during the Arctic winter when the North Pole is cast in 24-hour darkness.

Arctic Ice with carved out ship path taken by Daniel Watkins, Brown University.

How can we go about navigating this issue? Although most of the Arctic circle freezes up during winter, thus limiting shipping operations, being able to make ice forecasts is still vital to residents of the area, local tribal nations, climate records, and subsistence hunters. The specific variable of interest for this project is sea ice concentration, which is defined as the understanding of the percentile of ice present. For example, an 80% ice concentration means that there is an 80% chance that ice is present in that area – it has nothing to do with ice depth, thickness, or extent. Understanding sea ice concentrations is especially important during the spring and summer seasons, when monitoring areas where the ice edge meets ocean water becomes both difficult and an active threat to human safety. But… if satellites can’t tell us this information all year long, and buoys may not be a feasible option for continuous monitoring, what can we do?

This summer, I had the privilege of studying with ice scientists at the National Atmospheric Ocean Administration (NOAA) as a recipient of the Ernest F. Hollings student scholarship and internship program. I have family members who have worked in Alaska, Greenland, and Antarctica, which sparked my interest in studying polar meteorology and climatology. So, when I got to choose what research to do, it made the most sense for me to work on something that dealt with monitoring ice changes. I quickly became indoctrinated into the world of ice forecasting as a novice researcher with one primary goal: find a way to consistently monitor sea ice concentration for ice forecasting.

Our primary satellite products that we have been using as tools for our research are the Synthetic Aperture Radar (SAR), the NOAA – 20 Visual Infrared Imaging Radiometer Suite (VIIRS) sea ice concentration product, and an AI product by the title of IceLynx. IceLynx is trained purely off the data received by SAR, and SAR is essentially just a radar in space that shoots down lasers and creates an image based on the roughness of the surface the laser just hit. The upside to SAR is that it is not inhabited by lack of light or clouds, making it the perfect instrument for continuous sea ice concentration.

You may be thinking, Wow! If SAR can do all of that, why do we even need to do this research? Unfortunately, SAR sometimes gets things wrong. Sometimes, it can mistake rough winds on the surface of the ocean like ice. Or it can make mistakes with puddles that form on the top of ice as they melt as areas of open water. This problematic phenomenon is known as “tone reversal,” which makes SAR backscatter values rather difficult to interpret. For example, what if ice forecasters were to tell a shipping vessel there was a big patch of open water, when there is a thick sheet of ice with a few inches of melting water on top? Dangerous consequences may ensue. Since the IceLynx AI product is trained only off SAR, it is prone to inaccurate readings as well, wasting the time and energy of the ice forecasters.

A real Normalized Radar Cross Section (NCRS) of SAR data from October 29th, 2025. This is an active example of the data we are working with. Each greyish to black pixel that is present in areas of the Arctic Ocean is a different backscatter value displayed by the surface roughness read in by SAR. NOAA CoastWatch L1/L2 Spatial Search.

So, the primary goal of our research is the following: if we can derive a relationship between the SAR backscatter values and true sea ice concentrations from the VIIRS data, then we may be better able to navigate the issue of tone reversal and help retrain various AI products as well as inform ice forecasters what to look out for when tone reversal is occurring. If we can complete our goal utilizing ArcGIS Pro to parse through our satellite data and start examining statistical relationships that occur between certain backscatter values and sea ice concentrations, then we may be able to help the ice forecasters around the globe stop asking themselves: “Where the heck is the ice?”


Ryenne “Rye” C. Julian is a senior Atmospheric and Environmental Sciences (AES) undergraduate student set to graduate in December of 2026. They have had a variety of internship opportunities working with topics such as small-scale climate research, helping to write a climate action plan, studying micrometeorology and agrivoltaics, and most recently, studying how applied remote sensing methods can be used to study sea ice and better train ice forecasting AI programs with the National Oceanic and Atmospheric Administration (NOAA). Her passion for the study of ice came from the start of her undergraduate degree being spent at Northland College as a climatology student before transferring to South Dakota Mines in 2024 because of Northland College’s closure. At SD Mines they have been able to apply both meteorological and climatological methods to their studies.

A large-beaked Dilophosaurus in the foreground, with water and flying creatures in the background.

Reality and Realism in Dinosaur Fiction

Film, STS Students

By Paul Roques

Did you know that the Dilophosaurus wasn’t actually able to spit venom and was about 8 feet tall in real life? I sure didn’t until I was around 14, when I started doing more research on dinosaurs. Growing up, dinosaurs were my biggest passion. The first movie I remember watching was Jurassic Park (1993). Until my freshman year of college, my dream was to be a paleontologist; that’s even how I ended up at South Dakota Mines. However, things changed during the 2nd semester of my freshman year, when that route didn’t really fit me. That’s when I discovered STS through a friend and then later found my passion for the law. However, I felt it would be poetic to bring my studies full circle and do a project on paleontology. Therefore, my project will be an analysis of the ethics behind the misrepresentation of paleontology in science fiction films. I want to research this because of my passion for dinosaurs and how I believe we should all learn to love the current interpretations of dinosaurs versus the monster movie showbiz they are portrayed as.

Restoration of Early Jurassic environment preserved at the SGDS, with the theropod Dilophosaurus wetherilli in bird-like resting pose, demonstrating the manufacture of SGDS.18.T1 resting trace. Heather Kyoht Luterman, CC BY 2.5 https://creativecommons.org/licenses/by/2.5, via Wikimedia Commons.

From the 1960s to the 1990s, interest in dinosaur science increased. This was dubbed the “dinosaur renaissance” by Robert T. Bakker in 1975 (Chambers and McCahey, 2024). This then gave birth to a lot of dinosaur science fiction, the most famous being Jurassic Park. One of the things that these films have done is create a misrepresentation of the science and scientists behind them, such as portraying paleontologists as action heroes and depicting dinosaurs, like the Dilophosaurus, in a way that bears little resemblance to their real-life counterparts. To make the films more interesting, they have to add fictional details that would go against modern science, adding features that were never true. This has gotten to the point that a very select few people (that I have personally seen in comment sections) claim their favourite dinosaur is the Indominus Rex from Jurassic World (2015). For reference, the Indominus Rex was a hybrid of a few existing dinosaurs and does not exist in the scientific world.

Furthermore, there are many areas in the paleontological world where there hasn’t been great communication between scientists and the popular media. As a result, the media has grown to not always be able to distinguish between the speculative side of paleontology versus the factual side. For example, a species called the Troodon was classified as a dinosaur based on a single tooth. This species then got featured in movies and games alike due to its popularity among popculture. However, in 2017, Troodon was no longer seen as a valid species, as there was too little information to go on and too many similarities to other dinosaurs (University of Alberta, 2017). Even though this occurred, the news never reached the media and Troodon is still being used in the media and sold as toys.

Overall, I will be taking a look at prehistoric films to keep the project narrower, as expanding to other media like paleoarts or video games would make it too broad. However, this brings me back to my primary research question: why is the misrepresentation of dinosaur science important? It is important because these films can impact the public understanding of science, lead to an eventual lack of respect for scientific labor and credibility, and change the popular view of paleontology.

References

Chambers, A. C., & McCahey, D. (2024). 1990s dinomania: Public and popular cultures of palaeontology from Jurassic Park to Friends. Interdisciplinary Science Reviews, 49(3–4), 410–423. https://doi.org/10.1177/03080188241233121 

University of Alberta. (2017, August 8). Dino hips discovery unravels species riddle. ScienceDaily. Retrieved October 30, 2025 from www.sciencedaily.com/releases/2017/08/170808145519.html


Paul Roques is a senior Science, Technology, and Society major.

Hail no! Making Hailstones Smaller One Cloud Seed at a Time

Atmospheric Science Students

By Ashley Walker

Every year the United States suffers from millions of dollars of hail damage to crops, homes, businesses, etc. In 2023, hail resulted in $2.3 billion in damage in the United States alone (NOAA, 2024). Figuring out if we can minimize hail size could make a huge difference. My research focuses on the physics involved in cloud seeding and how this might influence hail formation.

Cloud seeding is a weather modification tool where substances like silver iodide are added to the atmosphere to produce precipitation if moisture is present in that atmosphere. The substances act as cloud condensation nuclei, which helps the formation of ice crystals. If the number of ice crystals were to increase, they would be competing to absorb water. As the water attaches to these particles, it freezes and combines with other droplets to form hail. This increased competition can result in smaller hailstones, which could cause less damage and help communities that are impacted by severe hailstorms. While a lot of research has been done on cloud seedings overall effects, like increasing rainfall, its ability to reduce hail size is not consistent in research. Studies have shown mixed results, some suggesting that cloud seeding does limit hail size, while other studies suggest that cloud seeding has no impact on hail size. These findings emphasize the need to further research to see if cloud seeding is a good tool to reduce hail size.

A very large hailstone cut in half revealing its “rings of growth.” This likely caused severe damage to the surrounding environment. Photo credit: NOAA Legacy Photo; OAR/ERL/Wave Propagation Laboratory (via Flickr).

To explore this, I am using the CM1 Model (Cloud Model 1) to simulate thunderstorms and study how cloud seeding might influence hail formation. CM1 is a numerical model that allows us to simulate weather like thunderstorms, squall lines, and other systems. The model allows the user to adjust different variables like temperature, moisture, and microphysics. This is an ideal tool to study the processes behind hail formation.

In Hot Water: The Global Change in Hurricane Intensity

Atmospheric Science Students

By Joshua Rowe

Since I was a kid, I have always had an interest in coastal weather. I saw the Pacific Ocean for the first time when I was four years old, and I was in awe of the immense size and natural harmony of the ocean. What sparked my interest in research in this field was the recent global change in tropical cyclone intensity. The warming of the oceans globally has led to an increase in the proportion of intense hurricanes (Holland, 2013). This struck me as immensely important because of the catastrophic impact that tropical storms can have on the lives and properties of anyone living in a coastal region. It is estimated that the average tropical storm in the US causes between seven and eleven thousand deaths per storm, and tropical storms have accounted for between 3.6 to 5.2 million deaths since 1930 in the U.S. (Garthwaite, 2024).

Dramatic View of Hurricane Florence from the International Space Station. Photo: NASA Goddard Space Flight Center, 2024 (CC by 2.0).

The United States is no stranger to tropical storms, and their unpredictability and aggression makes them a daunting task for coastal meteorologists to forecast. Hurricanes are formed as a result of a large amount of water vapor condensing and circulating over warm oceanic areas (Holland, 2014). When water vapor condenses into clouds, it releases large amounts of latent heat, which contributes to the available convective energy in the atmosphere. As the sea surface temperatures rise, the amount of evaporation over the ocean increases and subsequently the amount of available water vapor increases as well. This rise in available water vapor allows for more condensation and latent heat release, which creates a positive feedback relationship that is theorized to be the cause for the increased frequency, intensity, and location of intense hurricanes (Lackman, 2011).

An aerial view of a city showing a smoggy sky above the buildings.

Models: How accurate are they?

Atmospheric Science Students

By Ryleigh Czajkowski

I have always been curious about the weather and climate, as my dad was a pilot and used to teach me little things about the atmosphere. When I entered college, I decided to follow that curiosity by majoring in atmospheric sciences and developed a new interest in air quality along the way. Air quality is an issue that has global effects with potential detrimental impacts, and I would like to find a job that uses scientific understanding of air pollution to make impactful actions and policies. Specifically, I would like to go into pollution modeling and management to help mitigate the effects of pollution on communities and ecosystems.

This interest was sparked during an internship I had last summer as part of NASA’s Student Airborne Research Program (SARP). This experience allowed me to use airborne data to validate the Environmental Protection Agency’s (EPA) Community Multiscale Air Quality Model (CMAQ), to see how accurately the model predicts the concentrations of different pollutants. The CMAQ model works by incorporating meteorological (wind, temperature, etc.), emission, and chemical models to simulate the concentrations of trace gases, particulate matter, and atmospheric pollutants both spatially and temporally (EPA, 2022). 

A group of people standing outside near the tail of a plane with NASA on the tail.
Property of NASA SARP. Credit: Madison Landi.

For my senior capstone project, I will be expanding on my previous research to build a better understanding of the capabilities of the model, as it recently underwent an update in 2022 to improve the meteorological processes and emissions. I will focus on the South Coast Air Basin in California, an area with known, notable air quality issues (Chen, et al., 2020) and the levels of formaldehyde and methane there. Both methane and formaldehyde act as active gases in the atmosphere. With methane concentrations on the rise (Feng, et al., 2023) and formaldehyde as a health and environmental irritant (Lucken, et al., 2018), they are important gases to study and understand. I will be assessing how well the CMAQ model can simulate the concentrations of formaldehyde and methane in the atmosphere, as well as the accuracy of  the meteorological inputs (i.e., wind) as they greatly affect the behavior and amounts of those gasses. (Barsanti, et al., 2019). 

Alcohol and College Athletics

STS Students

By Sophia Grohs

My capstone will explore the crossroads of alcohol and college athletics. College athletes are unique in that most people will not get the chance to play after high school. At the same time, these athletes consume alcohol, a substance with addictive properties and a deterrent to high performance, at the same levels as their non-athlete peers. With alcohol’s prevalence in the strength and conditioning world, the NSCA (National Strength and Conditioning Association, the leading organization for strength and conditioning) barely mentions alcohol use in their Essentials of Strength and Conditioning (the primary book for certification). Coaches write programs and decisions under the assumptions that athletes are not drinking, but this is a flawed premise. This capstone will address the issue with those assumptions and strive to better inform coaches and athletes on how alcohol impacts athletic performance. I aim to be interdisciplinary in looking at the physiological, psychological, sports performance and social factors that impact athletes and alcohol consumption.  

Logo for the South Dakota Mines weight room, where I am currently an intern.

 In the strength and conditioning community, coaches write programs with the understanding that athletes are recovering within 48–72-hour time frames.  Athletes will often party on the weekends, and coaches can tell when athletes had too much come Monday morning. From a coaching perspective, it is hard to get max effort out of an athlete who is hungover. Because there is a lack of empirical research on the direct performance response to alcohol, there is no system in place to protect athletes from workouts and to guide coaches. At the same time, there has yet to be a longitudinal study that illustrates the impact of drinking and sports performance throughout an athlete’s career. There is no way to definitively tell a senior offensive lineman how much he could have bench pressed if he had not drunk regularly throughout his time in college.

The studies have mixed results about the impacts of drinking and collegiate sports performance. Alcohol and athletic performance can coexist (Steiner et al., 2015), and studies find that the negative consequences of drinking do not deter college students from drinking (Martinez et al., 2014). 72% of college athletes drink out of season (where most strength and conditioning training takes place), and 65% of athletes drink in-season (Mastroleo et al., 2019).  Other studies exclusively tested men or were conducted on rodents and found that drinking impacts muscle fiber but no other measures of performance (Rodrigues et al., 2019). Some studies have found that athletes who drink in moderation are not significantly impacted (Murphy et al., 2013). Research thus far has also found that drinking in moderation preserves athletic performance in comparison to binge drinking (Parr et al., 2014). Preventing college athletes from drinking has had moderate success (Mastroleo, et al., 2019). Most college athletes consume alcohol between Thursday and Saturday, but in-season team restrictions are a viable deterrent for athletes. Coaching and team policy can dictate culture and attitudes toward alcohol.

Mitigating the impacts from drinking cannot be seen as the only solution to improve the lives of student athletes. Coaches should focus on improving their team culture and building healthy relationships with their student athletes and value the holistic health of the athlete. Coaches are in the profession because we see the impact that sports can make. There is an obligation to act in the best interest of the athlete and a moral standard that we as coaches fight to uphold. To best do our job, we need to acknowledge that college athletes consume alcohol and adjust our coaching to that reality.

Sophia stands next to writing on a wall: "Through sport, students learn to deal with failure, work as a team, be disciplined and resilient. In short, athletics are central to our Yale mission."

References

Cui, Y., Huang, C., Momma, H., Sugiyama, S., Niu, K., & Nagatomi, R. (2019). The longitudinal association between alcohol consumption and muscle strength: A population-based prospective study. Journal of musculoskeletal & neuronal interactions19(3), 294.

Mastroleo, N. R., Barnett, N. P., & Bowers, K. M. (2019, July). Association between sex, race/ethnicity, season, day of week, and alcohol use and related risks in college student athletes and nonathletes. Journal of American College Health, 67(5), 422-432. Retrieved from https://doi.org/10.1080/07448481.2018.1484367

Murphy, A. P., Snape, A. E., Minett, G. M., Skein, M., & Duffield, R. (2013). The effect of post-match alcohol ingestion on recovery from competitive rugby league matches. The Journal of Strength & Conditioning Research, 27(5), 1304-1312.

Parr, E. B., Camera, D. M., Areta, J. L., Burke, L. M., Phillips, S. M., Hawley, J. A., & Coffey, V. G. (2014). Alcohol ingestion impairs maximal post-exercise rates of myofibrillar protein synthesis following a single bout of concurrent training. PLoS One9(2), e88384

Putukian, M. (2016). The psychological response to injury in student athletes: a narrative review with a focus on mental health. British Journal of Sports Medicine50(3), 145-148.

Steiner, J. L., Gordon, B. S., & Lang, C. H. (2015). Moderate alcohol consumption does not impair overload‐induced muscle hypertrophy and protein synthesis. Physiological reports3(3), e12333.


Sophia Grohs is a Science, Technology, and Society major. After I was medically retired from the Army, I came to Mines dead set on finishing a Civil Engineering Degree and working for the US Army Corps of Engineers. My first in-person class at Mines was Differential Equations. I passed but was miserable. Realizing I didn’t want to be an engineer, I found STS as the fastest path to graduation and a way to figure out what I wanted to do with my life. I am a gym-rat at heart. In Oct 2022, I reached out to Hardrocker Athletic Performance to intern to “test it as a career” and everything else has fallen into place. I passed the CSCS (test to be a college strength and conditioning coach), spent summer ‘23 interning at Yale (i.e.,, the 2023 Ivy League football champs), and will be coaching at Wagner College, a D1 institution in Staten Island, after graduation. Spending the summer at Yale taught me that coaching Strength and Conditioning is a people science and that majoring in STS has prepared me for the demands of the profession. Throughout the interview process I would tell coaches that I can “problem solve like an engineer” and communicate like I majored in social science.

Recidivism and Criminal Justice

STS Students

By Kyle Harris

My potential career interests include the criminal justice or law enforcement field, so I wanted my capstone to related to those particular fields. The topic of my capstone focuses on why the recidivism rates are so high in the United States, as well as what changes can be made in order to lower the recidivism rate. Recidivism is the tendency of a convicted individual to reengage in criminal behavior upon reentering society, resulting in their return to the criminal justice system after serving a previous sentence. Specifically, I will look at how punitive and rehabilitative approaches in the United States prison system can be balanced in a way that will be most effective for society and the prisoners themselves in terms of reintegration back into society.

The punitive approach to punishment in prison systems is characterized by a focus on retribution and deterrence. Under this philosophy, the primary goal of incarceration is to punish offenders for their crimes. This approach often involves imposing strict sentences, harsh living conditions, and limited privileges to create an environment that is meant to be punitive and discouraging (Raymond, 1979). Politicians adopted a “tough on crime” approach starting in the 1970s that has resulted in around 2 million Americans that are currently incarcerated and another 3 to 4 million Americans on probation or parole (Sawyer & Wagner, 2023).

The rehabilitative approach to punishment, on the other hand, emphasizes the transformation and reformation of offenders through targeted interventions and programs. Unlike punitive models that focus solely on punishment and deterrence, the rehabilitative approach aims to address the root causes of criminal behavior and equip inmates with the skills and support needed to reintegrate into society successfully. This approach often involves educational programs, vocational training, counseling, and mental health services to help individuals develop the necessary tools to lead law-abiding lives upon release (Forsberg & Douglas 2020). Norway, one of the most prominent nations in the focus of rehabilitation in their prison systems, reported one of the lowest recidivism rates in the world with a rate of 20% (Denny, 2016).

There are many reasons why we should care about working to lower the recidivism rates in America. According to the U.S. Bureau of Justice Statistics report, the recidivism rate for inmates in state prisons was 68% in 2020 (Jackson, 2020). The high recidivism rates in America indicate that the current correctional system may not be adequately addressing the root causes of criminal behavior or providing effective ways of integrating incarcerated individuals back into society. If individuals leave prison without the necessary tools and support to reintegrate into society, they have a high chance of facing challenges that increase the likelihood of returning to criminal activities. High rates of recidivism also place a strain on both federal and state budgets. The average annual cost of incarceration fee for a Federal inmate in a Federal facility was $39,158 (Bureau of Prisons, 2021). The cost of incarcerating individuals is substantial, and when offenders reoffend, it perpetuates a cycle of incarceration, leading to increased financial burdens on the criminal justice system.

While South Dakota, with a recidivism rate of 40.3% over a three year span from 2019-2022 (SD Department of Corrections, 2022), does not have a high rate compared to the rest of the country, seeing these rates go down in our own community would have very positive effects. Ninety-five percent of individuals currently incarcerated in the state of South Dakota will eventually be released. This highlights why it is important that while they are incarcerated, these inmates are provided with the necessary tools needed to become contributing members of society as they are released. The benefits that would be seen from the successful reintegration into society from these inmates would be felt in both the economy and the community as a whole.

My exploration of punitive and rehabilitative approaches in the criminal justice system involves a reflection on the real-world consequences of these methods. I am hoping that my project serves as a call to action, highlighting the ripple effects of high recidivism rates on societal safety, economic resources, and community well-being. There is a need in America for a nuanced and balanced approach to punishment. One that not only holds individuals accountable but also equips them with the tools for successful reintegration into society.

References

Annual Determination of Average Cost of Incarceration Fee (COIF). (2021, September 1). Federal Register. https://www.federalregister.gov/documents/2021/09/01/2021-18800/annual-determination-of-average-cost-of-incarceration-fee-coif.

Denny, Meagan (2016) “Norway’s prison system: Investigating recidivism and reintegration,” Bridges: A Journal of Student Research, 10 (10).

External data brief: Adult recidivism. (2023, March). South Dakota Department of Corrections. https://doc.sd.gov/documents/Data%20Brief%202.E%20Adult%20Recidivism.pdf.

Forsberg, L., & Douglas, T. (2022). What is criminal rehabilitation?. Criminal law and philosophy16(1), 103–126. https://doi.org/10.1007/s11572-020-09547-4.

Jackson, L. (2020). Prison is not for punishment. Aba Journal106(1), 9–10.

Raymond, F. B. (1979). Reasons we punish. Journal of Humanics, 7(2), 65–78.

Sawyer, W., & Wagner, P. (2023). Mass incarceration: The whole pie 2023. Prison Policy Initiative. https://www.prisonpolicy.org/reports/pie2023.html


Kyle Harris is a Science, Technology, & Society major. I am on the basketball team, and some of my hobbies include hanging out with friends and watching movies. The reason I chose STS as my major is due to the flexibility it has in career paths. Upon graduation, I plan on either going to graduate school for counselling or entering the criminal justice and/or law enforcement field.

Reef Revival

STS Students

By Keaton Gray

I had a really hard time narrowing down a topic for my capstone. I wanted to research so many things, and as soon as I got into research on a topic I’d learn about a whole other aspect and want to switch my project. I decided to focus my capstone on reef restoration because of my obsession with their beauty, but also because they are under immediate threat due to anthropocentric (i.e., human-caused) problems like climate change and pollution. Additionally, I have seen the negative effects of coral bleaching firsthand on the reefs surrounding the Big Island of Hawaii, and seeing it just makes your heart hurt!   

Restoration involves targeted efforts to repair or enhance damaged reef ecosystems. This process typically includes coral propagation and transplantation but also entails assisted evolution and assisted larvae dispersal (Boström-Einarsson et al 2020). My research focuses on two questions: 1) What are the most effective and sustainable methods for restoring coral reefs to promote reef resilience and 2) How can these strategies be applied in different coastal environments to maximize coastal protection and positively impact local communities?